The Economics and Statistics Division maintains archives of previous publications for accountability purposes, but makes no updates to keep these documents current with the latest data revisions from Statistics Canada. As a result, information in older documents may not be accurate. Please exercise caution when referring to older documents. For the latest information and historical data, please contact the individual listed to the right.
<--- Return to Archive
For additional information relating to this article, please contact:
October 25, 20172016 CENSUS: IMMIGRATION Statistics Canada today released data on immigration from the 2016 Census of Population.
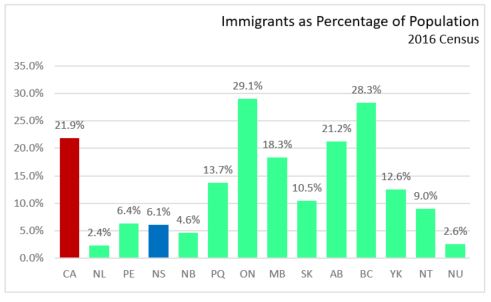
In 2016, Nova Scotia had a census population of 908,340, of which 55,675 (6.1 per cent) identified as immigrants. Nationally, 21.9 per cent of the population were immigrants. The highest percentage of immigrants in Canada were in Ontario (29.1 per cent) and British Columbia (28.3 per cent), while the lowest among provinces was in Newfoundland and Labrador (2.4 per cent).
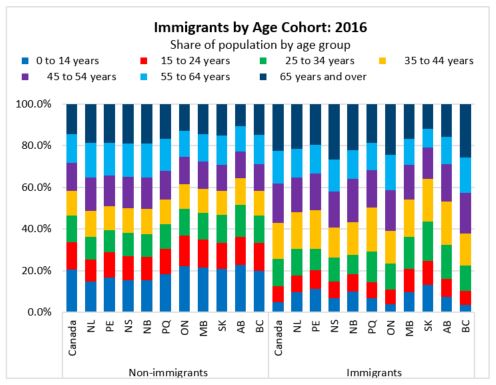
In Nova Scotia, 6.8 per cent of immigrants were in the 0 to 14 years-old cohort, 8.0 per cent were aged 15-24, 11.5 per cent were aged 25 to 34, 14.3 per cent were 35 to 44 years old, 17.4 per cent were 45 to 54 years old, 15.2 per cent were 55 to 64 years old, and 26.7 per cent were 65 years or older. In Canada, the highest proportion of 0-14 year old immigrants was in Saskatchewan, while the highest proportion of 65 years and older immigrants was in Nova Scotia.
Within Nova Scotia, the immigrant population was youngest (highest proportion in the 0-14 age cohort) in Halifax (8.1 per cent), noting that the non-immigrant population was also youngest in Halifax. The percentage of older immigrants (65 years and over) was highest in areas outside of the larger Census Agglomerations (41.4 per cent), and lowest in Halifax (20.4 per cent).

Across Nova Scotia's counties, percentage of immigrant population was highest in Halifax, followed by Annapolis, Lunenburg, Antigonish, Kings and Victoria.

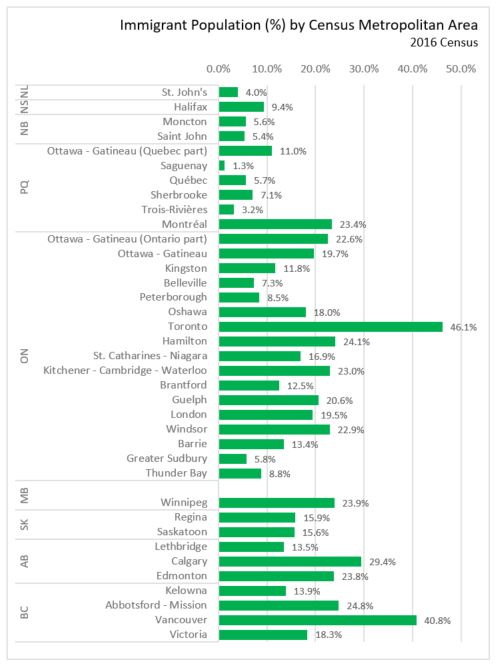
Among all Census Metropolitan Areas, Halifax ranked 26th (out of 37) in percentage of immigrants in the population. Highest was Toronto (46.1%), followed by Vancouver (40.8%), Calgary (29.4%) and Abbotsford (24.8%). Within the Atlantic Region, St. John's had 4.0 per cent of the population as immigrants, Saint John had 5.4 per cent and Moncton had 5.6 per cent.
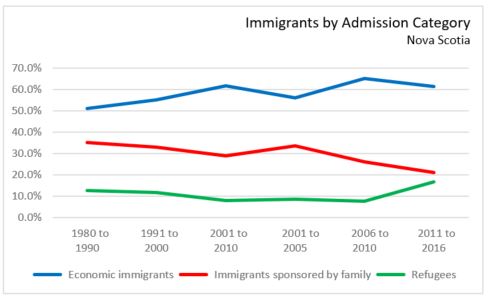
Immigrants can be economic immigrants (worker programs, business programs, provincial and territorial nominees), sponsored by families, refugees, or can be otherwise classified.
Nova Scotia's Economic Immigrants in the census time frame of 2011-2016 totaled 7,245 (61.5% of the total). Immigrants sponsored by families represented 21.1 per cent of the total, and refugees were 16.8 per cent of the total between those years. Compared to previous census time frames, this represents the highest number of immigrants to Nova Scotia, although economic migrants represented a higher percentage of immigrants in 2001-2006 (61.9%) and 2006-2011 (65.3%). Provincial nominees in 2011-2016 totaled 4,550, the highest of any of the last six census periods. Refugees in 2011-2016 totaled 2,490, or 21.1 per cent of immigrants over the time period.
For more information, see Statistics Canada's article and associated data on the Census page.
<--- Return to Archive