The Economics and Statistics Division maintains archives of previous publications for accountability purposes, but makes no updates to keep these documents current with the latest data revisions from Statistics Canada. As a result, information in older documents may not be accurate. Please exercise caution when referring to older documents. For the latest information and historical data, please contact the individual listed to the right.
<--- Return to Archive
For additional information relating to this article, please contact:
January 26, 2018ANALYSIS OF NOVA SCOTIA'S CONSUMER PRICE INDEX FOR DECEMBER 2017 AND 2017 ANNUAL DECEMBER 2017
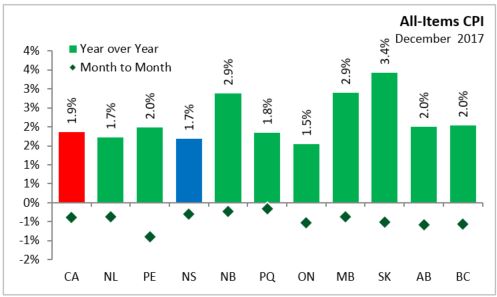
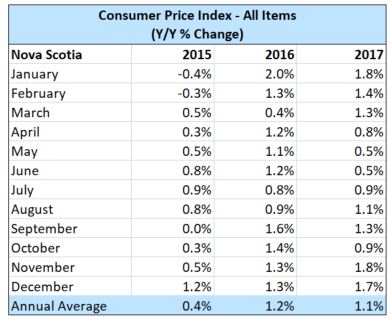
In Nova Scotia December 2017, year over year growth was 1.7 per cent, below the national average of 1.9 per cent. Monthly consumer prices were down 0.3 per cent in Nova Scotia and down 0.4 per cent in Canada.
Within Atlantic Canada, PEI (+2.0) and New Brunswick (+2.9 per cent) had higher inflation than Nova Scotia. Newfoundland and Labrador also saw a 1.7 per cent increase in prices. On July 1, 2016, the provincial component of the harmonized sales tax (HST) increased in both Newfoundland and Labrador and New Brunswick. In Prince Edward Island, the provincial component of the HST was increased effective October 1, 2016.
All other provinces experienced positive year over year inflation in December.
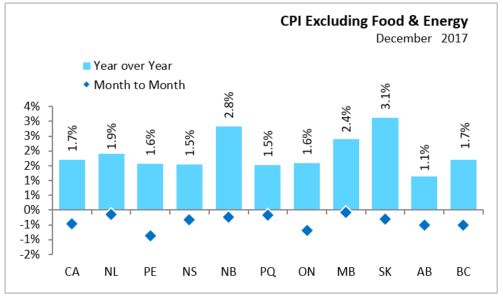
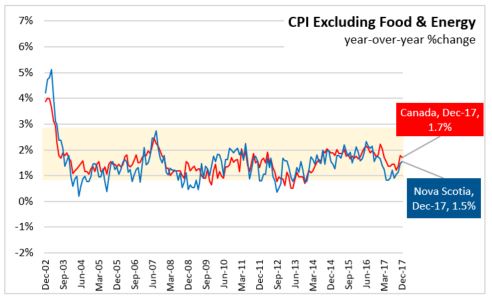
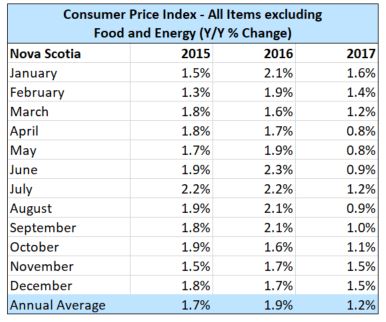
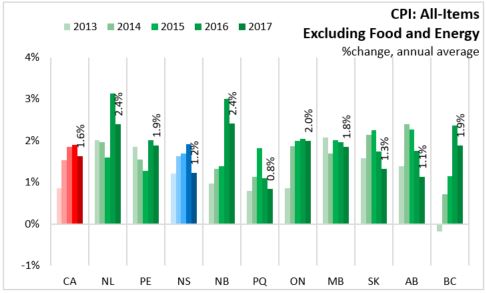
Nova Scotia's annual consumer price inflation (year over year growth in CPI) excluding food and energy rose 1.5 per cent in December, below the national rate of 1.7 per cent. Price level gains for this index were largest in Saskatchewan (+3.1 per cent) and New Brunswick (+2.8 per cent), and lowest in Alberta (+1.1 per cent). On a monthly basis, Nova Scotia's index excluding food and energy was down 0.3 per cent.
The main contributors to the monthly (December 2017 vs. November 2017) NS CPI movement:
Fresh vegetables (+6.9%)
Inter-City Transportation (+3.3%)
Fuel oil and other fuels (+3.3%)
Traveller accommodation (-7.0%)
Men's clothing (-7.2%)
The main contributors to the annual (December 2017 vs. December 2016) NS CPI movement:
Inter-City transportation (+11.4%)
Fuel oil and other fuels (+7.3%)
Recreational equipment and services (excluding recreational vehicles) (-4.6%)
Home entertainment equipment, parts and services (-8.1%)
The CPI for food in Nova Scotia increased 1.0 per cent year-over-year with a 0.3 per cent increase month-over-month. CPI growth in food (year over year) was up in all provinces. Nationally, annual food prices increased 2.0 per cent.

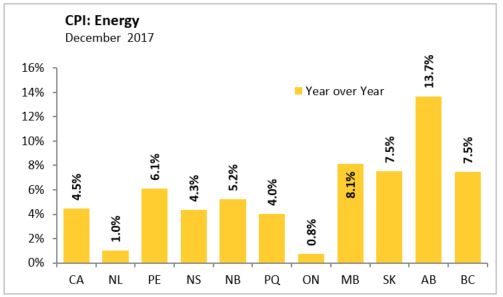
The Nova Scotia energy index increased by 4.3 per cent compared to a year ago. Energy price growth was smallest in Ontario on a year over year basis (+0.8%) and largest in Alberta (+13.7%). Nationally, the index was up 4.5 per cent.
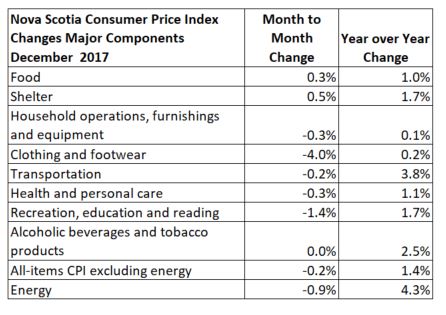
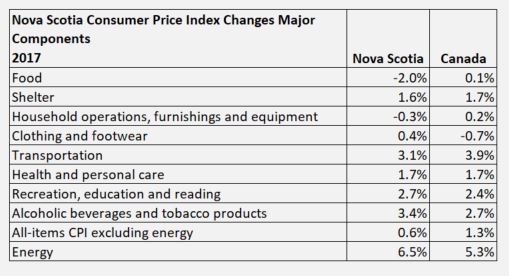
Major Components for December 2017
The following table shows the price increases specific to Nova Scotia for the major components of the CPI this month:
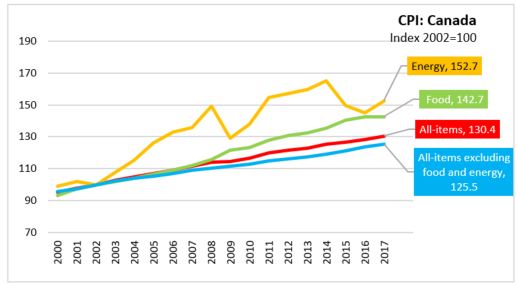
Long Run Trends
The All-Items CPI year over year inflation rate for Nova Scotia was below Canada's in December 2017. Since July 2014, Nova Scotia's annual inflation has been below the Canadian average except for three months in 2016: January, September and November. While month to month movements in the indices can be different, over time they generally follow the same overall trend.

Annual inflation for the CPI excluding food and energy was lower for Nova Scotia (+1.5 per cent) than for Canada (+1.7 per cent).
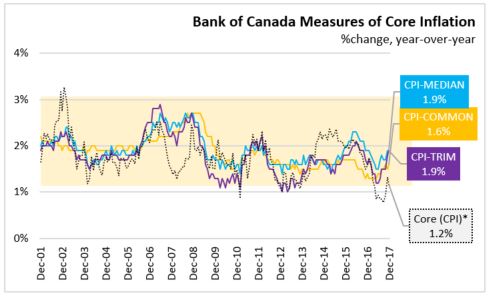
Bank of Canada's preferred measures of core inflation
Compared with December 2016, CPI-Common rose 1.6 per cent, CPI-Median rose 1.9 per cent, and CPI-Trim rose 1.9 per cent in Canada. All-items CPI excluding eight of the most volatile components as defined by the Bank of Canada and excluding the effect of changes in indirect taxes (formerly referred to as CPIX) rose 1.2 per cent year over year in December 2017.
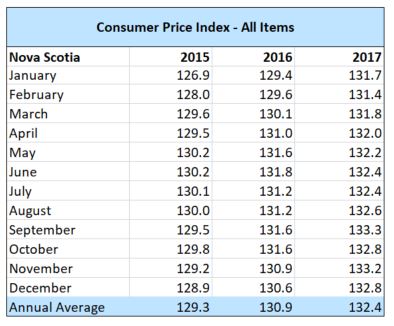
ANNUAL CONSUMER PRICE INDEX
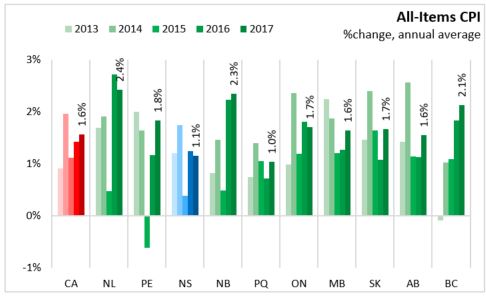
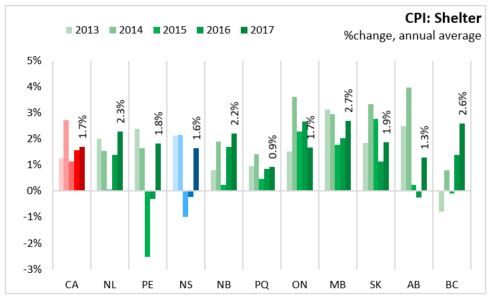
Comparing 2017 to 2016, the All-Items consumer price index for Nova Scotia rose 1.1 per cent, down from 1.2 per cent in 2016. Across Canada, prices were up 1.6 per cent in 2017 compared to 2016, with the largest price increases in Newfoundland and Labrador (+2.4%) and New Brunswick (+2.3%).
A look at the major components of Nova Scotia's CPI shows six of eight major components (the first eight in the table below, not including the energy related indices) showed increases. Food and household furnishing prices are, on average, down in 2017 from 2016. Notable price increases were seen in Alcoholic Beverages and tobacco products, Transportation, and recreation, education and reading. Slight price increases were seen in clothing and footwear.
Nationally, seven of the eight major components saw price increases.
For Canada and Nova Scotia, the energy index is the most volatile from year to year. The All-Items, the food index, and the all items excluding food and energy indices tend to trend upward from year to year.

Appendix Tables and Charts

Source: Statistics Canada CANSIM Tables 326-0020 , 326-0023, 326-0021 (Annual)
<--- Return to Archive