The Economics and Statistics Division maintains archives of previous publications for accountability purposes, but makes no updates to keep these documents current with the latest data revisions from Statistics Canada. As a result, information in older documents may not be accurate. Please exercise caution when referring to older documents. For the latest information and historical data, please contact the individual listed to the right.
<--- Return to Archive
For additional information relating to this article, please contact:
February 16, 2018MANUFACTURING SHIPMENTS, DECEMBER and ANNUAL 2017 DECEMBER
Nova Scotia
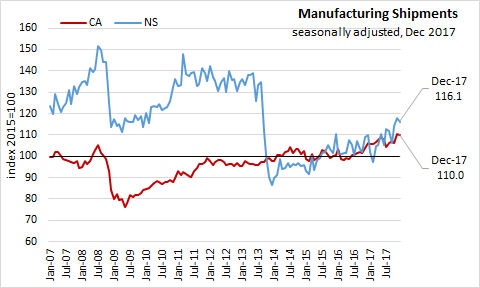
Nova Scotia’s seasonally adjusted manufacturing shipments decreased 1.3% in December 2017 to $748 million, and increased 5.6% over December 2016. The manufacturing shipments index (2015=100), declined 1.6 points to 116.1.
Canada
In Canada December 2017, manufacturing sales declined 0.3% over November 2017 to $55.5 billion, and increased 3.7% over December 2016. Compared to November 2017, overall sales decreased in 11 of 21 industries as durable goods increased 0.7% and non-durable goods decreased 1.3%.
Manufacturing sales declines were led by a 4.1% decline to $5.7 billion in petroleum and coal industry. Food industry was down 2.6% to $8.5 billion, as were primary metals (-2.0%) and fabricated metal products (-2.3%).
Declining sales were partially offset by increases in motor vehicle (+2.6%), machinery (+3.0%), computer and electronic products (+7.4%) and aerospace products and parts (+4.2%) industries.
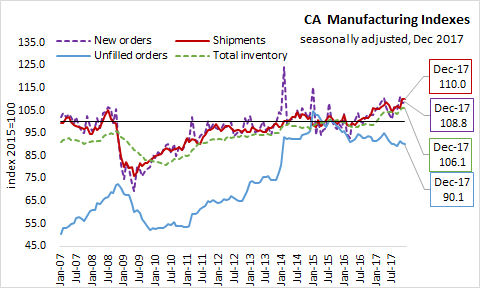
Inventory levels increased 0.1% in December 2017 to $75.3 billion. The Inventory to sales ratio increased from 1.35 to 1.36. Unfilled orders were decreased 0.7% to $86.0 billion, and new orders increased 0.3% to $54.9 billion over November 2017.
Provinces
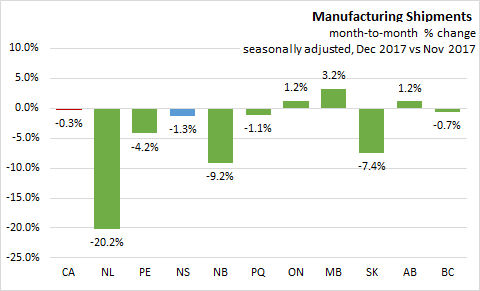
Manufacturing sales were down in seven provinces in December 2017. Newfoundland had the largest month-over-month seasonally adjusted decline at 20.2%.
In December, Manitoba led the way with 3.2% growth over November 2017. Nova Scotia ranked 6th at -1.3%. The Canadian average was -0.3%.
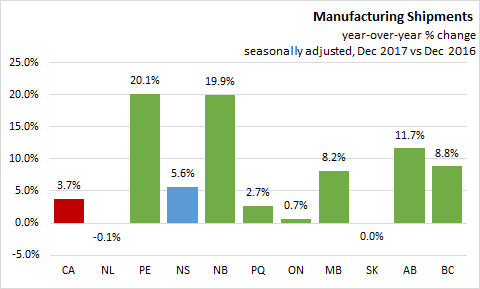
On a year-over-year basis (seasonally adjusted), manufacturing shipments are up 3.7% in Canada, with eight provinces recording positive year-over-year growth.Prince Edward Island (+20.1%) reported the fastest growth. Nova Scotia ranked 6th with manufacturing shipments increasing 5.6% over December 2016.
ANNUAL
Nova Scotia
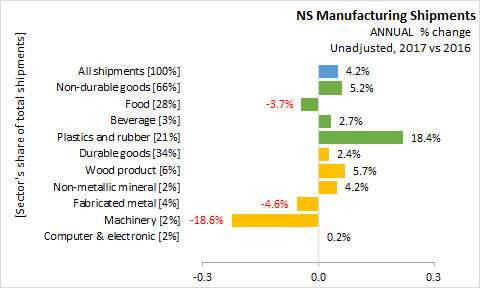
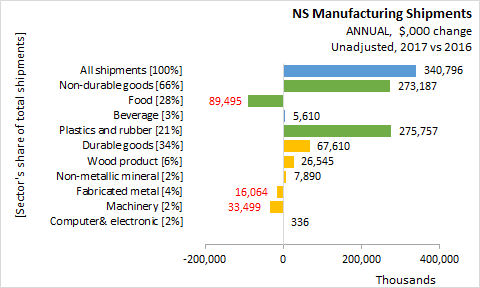
In 2017, unadjusted All shipments increased 4.2% ($340.8 million) over 2016:
Non-durable goods shipments account for 66% of Manufacturing Shipments and increased 5.2% ($273.2 million)
- Food with a 28% share decreased -3.7% ($-89.5 million)
- Beverage with a 3% share increased 2.7% ($5.6 million)
- Plastics and rubber with a 21% share increased 18.4% ($275.8 million)
Durable goods shipments account for 34% of Manufacturing Shipments and increased 2.4% ($67.6 million)
- Wood product with a 6% share increased 5.7% ($26.5 million)
- Non-metallic mineral with a 2% share increased 4.2% ($7.9 million)
- Fabricated metal with a 4% share decreased -4.6% ($-16.1 million)
- Machinery with a 2% share decreased -18.6% ($-33.5 million)
- Computer & electronic with a 2% share increased 0.2% ($0.3 million)
Provinces
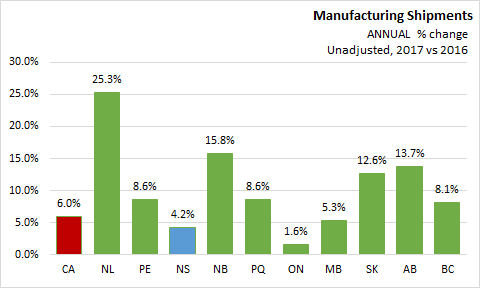
On an unadjusted annual basis, manufacturing shipments growth was positive in all provinces. Canada reported +6.0% growth in 2017 compared 2016. The largest gains were reported in Newfoundland and Labrador (+25.3%), with notable gains in New Brunswick (+15.8%), Saskatchewan (+12.6%) and Alberta (+13.7%). Nova Scotia ranked 9th with manufacturing shipments increasing 4.2%.
Statistics Canada Manufacturing Shipments December 2017 and CANSIM 304-0015 and 304-0014
<--- Return to Archive