The Economics and Statistics Division maintains archives of previous publications for accountability purposes, but makes no updates to keep these documents current with the latest data revisions from Statistics Canada. As a result, information in older documents may not be accurate. Please exercise caution when referring to older documents. For the latest information and historical data, please contact the individual listed to the right.
<--- Return to Archive
For additional information relating to this article, please contact:
February 21, 2018FOOD SERVICES AND DRINKING PLACES, DECEMBER AND ANNUAL 2017 DECEMBER
In 2014 and 2015, Nova Scotia's food service and drinking place receipts grew at a similar pace to the national average. In 2016, Nova Scotia's food services and drinking places reported sales growth that exceeded the national pace before falling below the national pace early in 2017.
In December 2017, the seasonally adjusted Nova Scotia Food services and drinking places index (2015=100) declined 0.8 points to 110.6, over November 2017. The Canada food service and drinking places index increased 0.9 points to 114.9, over November 2017.
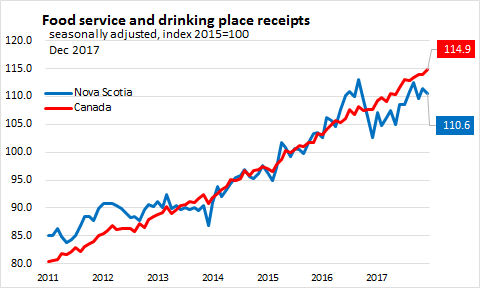
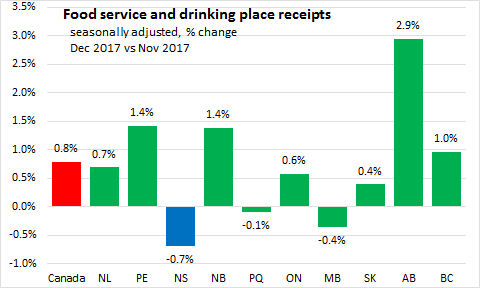
Statistics Canada reports that during December 2017, receipts of food services and drinking places in Nova Scotia decreased by 0.7 per cent (seasonally adjusted) to $136.4 million. National food service and drinking place receipts increased 0.8 per cent to $5.85 billion over November 2017.
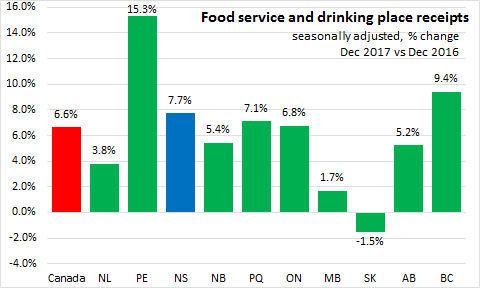
On a year-over-year basis (comparing December 2017 with December 2016), food service and drinking place receipts were up 7.7 per cent in Nova Scotia while national sales were up 6.6 per cent.
ANNUAL
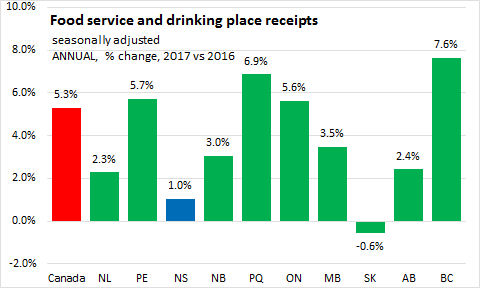
In 2017, Nova Scotia's food service and drinking place receipts were up 1.0 per cent while national totals increased 5.3 per cent over the same period last year.
Among categories (data reflect unadjusted totals for the 2017), Nova Scotia's special food services reported lower receipts. These losses were offset by gains among limited services eating places, full-service restaurants, and drinking places.


BACKGROUND: FOOD SERVICES AND DRINKING PLACES
Each month, Statistics Canada reports on receipts of food services and drinking places for Canada and the Provinces. Food service and drinking place receipts are seasonally adjusted. More detailed data on receipts by type of establishment are available monthly, but these are not seasonally adjusted so only year-over-year or year-to-date analysis is appropriate.
Food service and drinking place establishments include:
- full-service restaurants where patrons order and are served while seated and pay after eating
- limited-service restaurants where patrons order/select items at a counter and pay before eating either on premises or as take-out
- special food services, such as institutional food contractors, caterers or mobile food providers
- drinking places primarily engaged in serving alcoholic beverages for immediate consumption (though they sometimes provide limited food services as well)
Source: Statistics Canada, CANSIM table 355-0006
<--- Return to Archive