The Economics and Statistics Division maintains archives of previous publications for accountability purposes, but makes no updates to keep these documents current with the latest data revisions from Statistics Canada. As a result, information in older documents may not be accurate. Please exercise caution when referring to older documents. For the latest information and historical data, please contact the individual listed to the right.
<--- Return to Archive
For additional information relating to this article, please contact:
March 16, 2018MANUFACTURING SHIPMENTS, JANUARY 2018 Nova Scotia

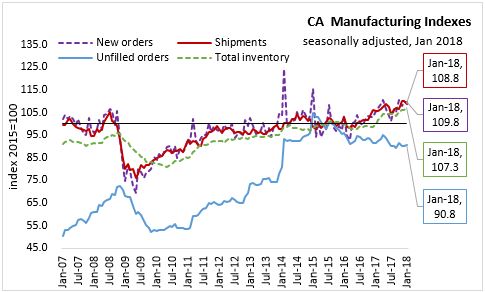
Nova Scotia’s seasonally adjusted manufacturing shipments decreased 7.0% in January 2018 to $706 million, and increased 7.7 per cent over January 2017. The manufacturing shipments index (2015=100), declined to 109.5.

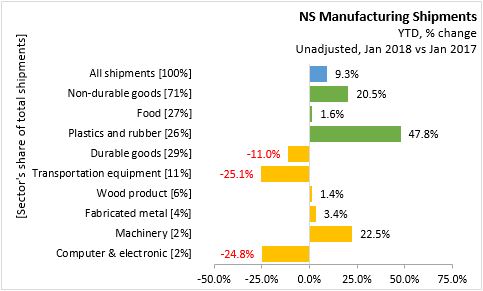
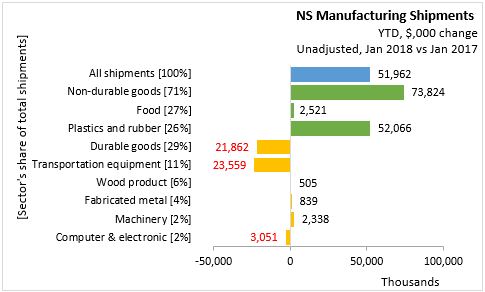
In January 2018, unadjusted All shipments increased 9.3 per cent ($52.0 million) over January 2017:
Non-durable goods shipments account for 71% of Manufacturing Shipments and increased 20.5% ($73.8 million)
- Food with a 27% share increased 1.6 per cent ($2.5 million)
- Plastics and rubber with a 26% share increased 47.8 ($52.1 million)
Durable goods shipments account for 29% of Manufacturing Shipments and declined 11.0 per cent (-$21.9 million)
- Transportation equipment with a share of 11% decreased 25.1 per cent ($23.6 million)
- Wood product with a 6% share increased 1.4 per cent ($0.5 million)
- Fabricated metal with a 4% share increased 3.4 per cent ($0.8 million)
- Machinery with a 2% share increased 22.5 per cent ($2.3 million)
- Computer & electronic with a 2% share decreased 24.8 per cent (-$3.0 million)
Canada
In Canada, manufacturing sales declined 1.0 per cent over December 2017 to $54.9 billion, and increased 2.9% over January 2017. Compared to December 2017, overall sales decreased in 14 of 21 industries as durable goods declined 3.5 per cent and non-durable goods increased 1.7 per cent.
The largest declines were in the sales of motor vehicles, down 8.0 per cent to $4.9 billion reflecting lower production due to atypical assembly plant shutdowns. Aerospace product and parts production was down 9.5 per cent to $1.6 billion, along with sales in the primary metal industry which declined 2.8 per cent to $4.1 billion. There were also declines in wood product (-4.1 per cent), machinery (-3.1 per cent) and paper (-4.0 per cent) industries.
Declining sales were partially offset by increases in petroleum and coal products (+6.5 per cent, reflecting higher prices) and chemical manufacturing (+6.1 per cent) industries.
Inventory levels increased 0.9% in January 2018 to $76.1 billion. The Inventory to sales ratio increased from 1.36 to 1.39. Unfilled orders increased by 0.6 per cent to $86.7 billion, and new orders increased by 0.1 per cent to $55.4 billion.
Provinces
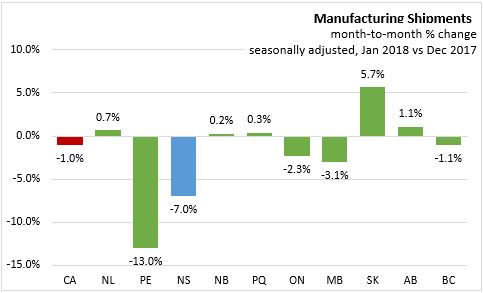
Manufacturing sales were down in five provinces in January 2018. Price Edward Island had the largest month-over-month seasonally adjusted decline at 13.0 per cent. Nova Scotia posted the second largest decline at -7.0 per cent. Saskatchewan led the provinces with 5.7 per cent growth over December 2017.
On a year-over-year basis (seasonally adjusted), manufacturing shipments were up 2.9 per cent in Canada and 7.7 per cent in Nova Scotia, with eight provinces recording positive year-over-year growth. New Brunswick reported the fastest growth at 15.2 per cent.

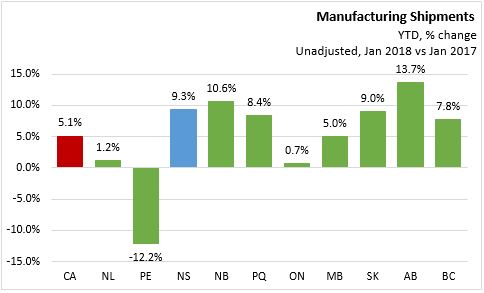
On an unadjusted basis, year-over-year manufacturing shipments growth was positive in all provinces except Prince Edward Island (-12.2 per cent). Canada reported 5.1 per cent growth in January 2018 compared to the same month in 2017. Nova Scotia's unadjusted manufacturing shipments reported 9.3 per cent growth over January 2017. The largest gains were reported in Alberta (+13.7 per cent), with notable gains in New Brunswick (+10.6%) and Saskatchewan (+9.0%).
Statistics Canada Manufacturing Shipments January 2018 and CANSIM 304-0015 and 304-0014
<--- Return to Archive