The Economics and Statistics Division maintains archives of previous publications for accountability purposes, but makes no updates to keep these documents current with the latest data revisions from Statistics Canada. As a result, information in older documents may not be accurate. Please exercise caution when referring to older documents. For the latest information and historical data, please contact the individual listed to the right.
<--- Return to Archive
For additional information relating to this article, please contact:
March 26, 2018ANNUAL HOUSEHOLD WEALTH, 2017 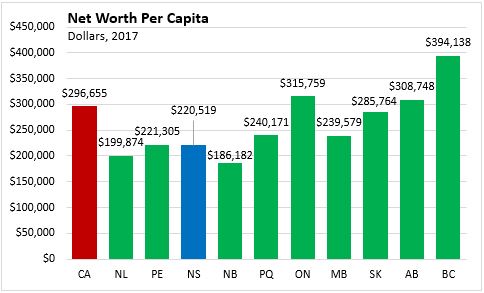
In 2017, Nova Scotia's per capita net worth was $220,519, compared to the national average of $296,655. Per capita net worth was the highest in British Columbia ($394,138) and Ontario ($315,759), while it was the lowest in New Brunswick ($186,182).
Nova Scotia's total assets per capita was $259,818 in 2017, comprised of $163,073 of financial assets and $96,746 of non-financial assets. Of its non-financial assets, Nova Scotia had $78,061 in real estate assets. British Columbia had the highest per capita assets while New Brunswick had the lowest.
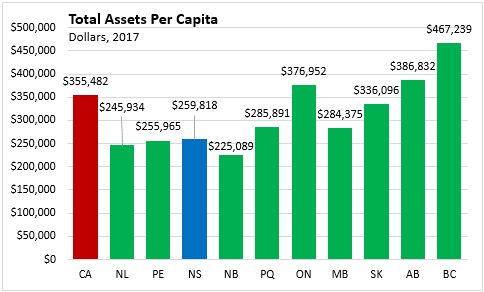
The variation in per capita assets across the country is primarily due to in differences in real estate assets. British Columbia and Ontario had the highest real estate assets per capita in 2017, while New Brunswick (and the Atlantic provinces in general) had the lowest.

Of Nova Scotia's $163,073 per capita financial assets, $80,669 was in life insurance and pensions, while $82,403 was in other financial assets. Differences in financial assets across the country is largely due to the variation in other financial assets, while life insurance and pension assets per capita have much smaller variation across the provinces. The Atlantic provinces had the lowest values of other financial assets per capita, while the Western provinces had the highest. New Brunswick had the largest value of per capita life insurance and pension assets ($89,845) and the smallest other financial assets ($50,743), while the reverse was true for Alberta ($57,360 in life insurance and pensions and $150,975 in other financial assets per capita).

Nova Scotia's total liabilities per capita were $39,300 in 2017, compared to the national average of $58,826. The largest value of liabilities per capita was in Alberta ($78,084) while the smallest was in Prince Edward Island ($34,653).

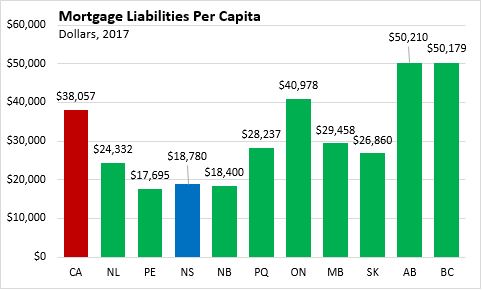
The differences in liabilities across the country are primarily due to differences in mortgage liabilities. Nova Scotia's per capita mortgage liabilities was $18,780 in 2017. As with total liabilities, Alberta had the largest per capita mortgage liabilities at $50,210, followed closely by British Columbia at $50,179. The smallest was in Prince Edward Island at $17,695.
Source: Statistics Canada, Daily Release
CANSIM Tables 378-0151 and 051-0001
<--- Return to Archive