The Economics and Statistics Division maintains archives of previous publications for accountability purposes, but makes no updates to keep these documents current with the latest data revisions from Statistics Canada. As a result, information in older documents may not be accurate. Please exercise caution when referring to older documents. For the latest information and historical data, please contact the individual listed to the right.
<--- Return to Archive
For additional information relating to this article, please contact:
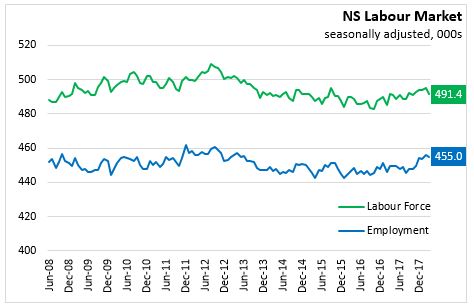
April 06, 2018LABOUR MARKET TRENDS - MARCH 2018 Nova Scotia's seasonally adjusted employment decreased by 1,300 to 455,000 in March 2018. This decrease follows an increase of 2,800 in February. Despite the decline, Nova Scotia’s employment level still remains at a high level. The last time the employment stood above 455,000 was in June 2013.
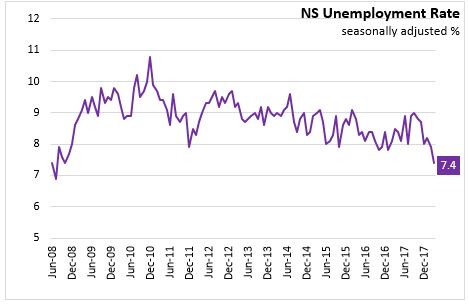
Compared to February, Nova Scotia’s labour force decreased by 3,900 to 491,400 in March. With labour supply declining at a faster pace than labour demand, the net result was a 0.5 percentage point fall in the seasonally adjusted unemployment rate to 7.4 per cent in March. This is the lowest unemployment rate in Nova Scotia since October 2008.
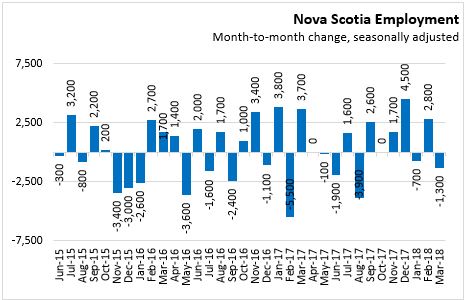
In March, the decline in employment was distributed across both full-time employment (- 400) and part-time employment with a decrease of 900. Changes in part-time and full-time employment can include the net impacts of changing hours of work within the same position.
Year-to Date (January- March 2018 vs. January- March 2017)
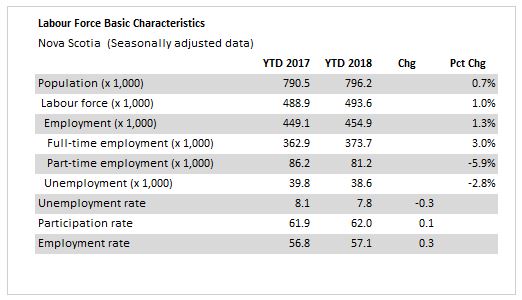
Comparing the first quarter of 2018 to the same period in 2017, there was an increase of 5,900 (1.3 per cent) in the average employment level. Full time employment was up 10,900 while there were 5,100 fewer part-time jobs.
The labour force was up 4,700 compared to the first quarter of 2017. With labour demand increasing at a faster pace, the net result was a drop in the average unemployment rate of 0.3 percentage point to 7.8 per cent. The labour force participation rate increased by 0.1 percentage points to 62.0 per cent. The employment rate increased to 57.1 per cent.
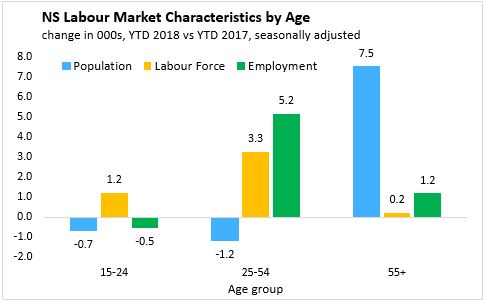
Age Cohorts
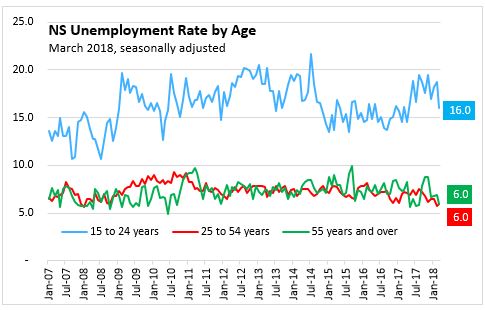
Comparing the first quarter of 2018 to the same period in 2017, the youth population (aged 15-24) saw a decrease in population (-700) and a drop-in employment (-500) while the labour force increased by 1,200. With labour supply increasing faster than labour demand, the unemployment rate for 15-24 year of age increased from 15.4 per cent in the first quarter of 2017 to 17.6 per cent in the first quarter of 2018.
Within the 25-54 age cohort, the population declined 1,200 over the first three months of the year, but saw an employment increase of 5,200 and labour supply increase of 3,300. With employment increasing faster than the labour supply, there was a 0.7 per cent decline in the unemployment rate for this cohort, dropping to 6.1 per cent for the first three months of 2018.
The cohort aged 55 and older saw a population increase of 7,500 over the first quarter of last year, a labour force increase of 200 and employment gains of 1,200. With labour demand growing faster than the labour supply, there was a decrease in the unemployment rate to 6.6 per cent (compared to 7.4% over the first quarter of 2017).
Sectors
Looking at public and private sector employees for the first quarter of 2018, the employment increase in private sector employees (5,700) was the driving force offsetting decreases in public sector employees (-1,800). For the same period self-employment was up 1,900.
Among goods-producing sectors, the first quarter of 2018 saw employment growth concentrated in manufacturing (+3,300) offsetting declines in forestry, fishing, hunting, mining and oil and gas. Construction also reported growth. Services-producing employment increased by 2,400 for the first quarter over the same period in 2017. The largest increases come from education services and food and accommodation sectors. The largest decline came from health care and social assistance.

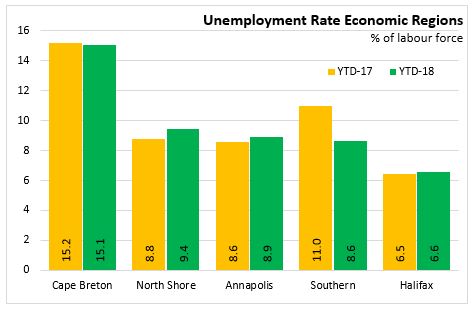
Regions (3 month moving average, January- March 2018 vs. January- March 2017)
Comparing the 3-month average for the first quarter of 2018 with the same period in 2017, two regions (Annapolis Valley, and Halifax) reported labour force growth that outpaced employment growth, resulting in higher average unemployment rates. The North Shore region had falling employment and labour supply causing upward pressure on their unemployment rates. Cape Breton had slightly less employment and labour supply resulting a slight down ward adjustment to their unemployment rate.
The Cape Breton region reported a 200 job decrease with 200 less in the labour force for the first quarter of 2018 over the same period in 2017. The net result was a 0.1 percentage point decrease in the unemployment rate to 15.1 per cent.
For the North Shore region, employment decreased 2,900 for the first quarter of 2018 compared to the same period in 2017 while the labour force declined 2,700. The faster decline for employment relative to labour supply resulted in an increase to the unemployment rate to 9.4 per cent.
The Annapolis Valley reported an increase in employment of 3,700 and an increase in the labour force of 4,300 for the first quarter comparison. The net result was an increase of 0.3 percentage points in the average unemployment rate to 8.9 per cent
The Southern region saw a decrease of 100 in employment along with a drop of 1,400 in the labour force. With the labour force falling at a faster pace, the unemployment rate was down 2.3 percentage points to 8.6 per cent compared to the first quarter of 2017.
Comparing the first quarter of 2018 to the first quarter of 2017 estimates, Halifax (HRM) experienced an increase in employment of 5,100 (along with an increase in the labour force of 5,500). With the labour supply growing faster than labour demand, the unemployment rate increased by 0.1 percentage point to 6.6 per cent in Halifax.
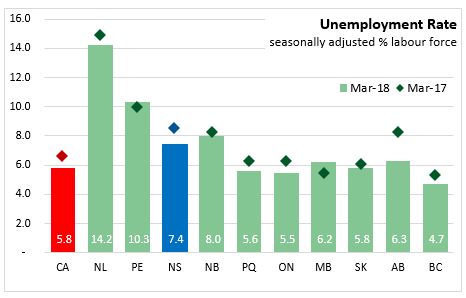
Provincial Comparisons
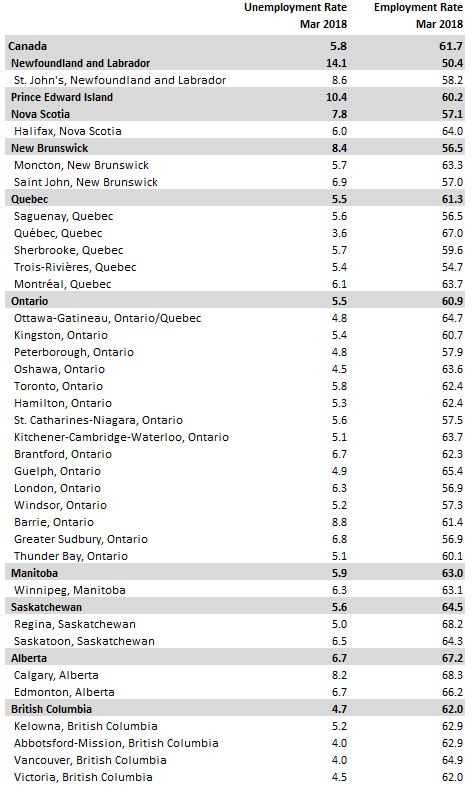
The Nova Scotia unemployment rate was 7.4 per cent in March 2018. In March of last year, the unemployment rate was 8.5 per cent in Nova Scotia. The Canadian unemployment rate was 5.8 per cent, down from 6.6 per cent one year ago. Compared to the same month one year ago, only Prince Edward Island and Manitoba reported a higher unemployment rate. Alberta had the steepest decline (2.0 percentage points). The lowest unemployment rate among the provinces in March 2018 was in British Columbia (4.7 per cent) while the highest was in Newfoundland and Labrador at 14.2 per cent.
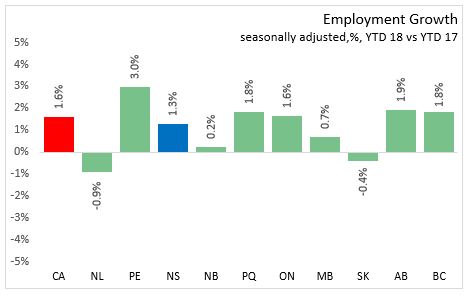
Comparing January-March 2018 with January-March 2017, employment increased 1.6 per cent in Canada. Employment grew in eight of the ten provinces, with the largest gains in Prince Edward Island (+3.0 per cent), Alberta (+1.9 per cent) and Quebec and British Columbia (both +1.8%). Employment declined in Newfoundland and Labrador (-0.9 per cent) and Saskatchewan (-0.4 per cent).
National Comparisons: Cities
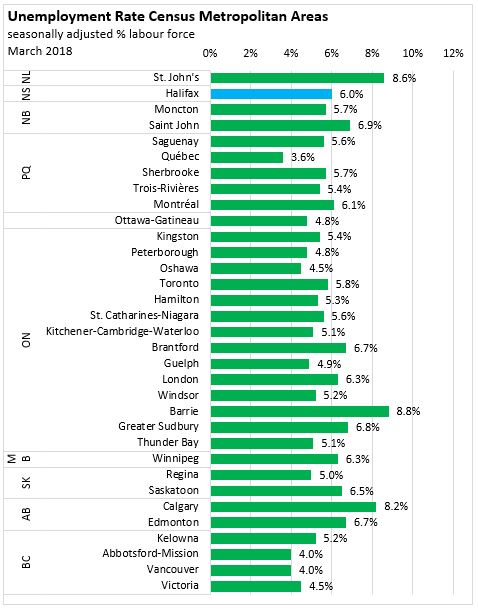
The seasonally adjusted unemployment rate for the Halifax Census Metropolitan Area (CMA) in March was 6.0 per cent. Quebec (3.6 per cent) had the lowest unemployment rate among CMAs in March, while the highest was in Barrie (8.8 per cent).
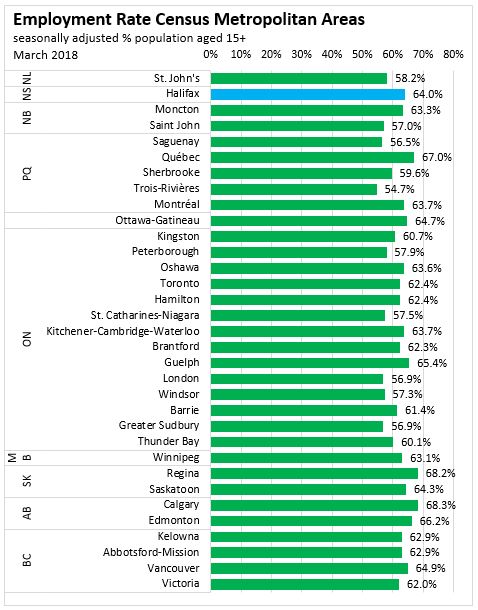
The seasonally adjusted employment rate for the Halifax CMA was 64.0 per cent, up from 63.4 last month. Trois-Rivieres had the lowest employment rates (54.7 per cent), while Calgary had the highest (68.3 per cent).
The three month average employment ending in March for the Halifax CMA was up 1.2 per cent compared to the three month period ending in February. The largest gain among CMAs was in Oshawa, ON where employment rose by 2.3 per cent.
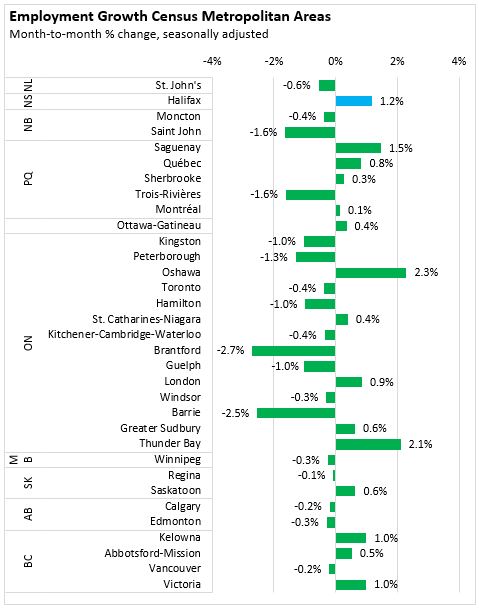
Note: Seasonally adjusted, 3 month average.
<--- Return to Archive