The Economics and Statistics Division maintains archives of previous publications for accountability purposes, but makes no updates to keep these documents current with the latest data revisions from Statistics Canada. As a result, information in older documents may not be accurate. Please exercise caution when referring to older documents. For the latest information and historical data, please contact the individual listed to the right.
<--- Return to Archive
For additional information relating to this article, please contact:
April 10, 2018CMHC PRELIMINARY HOUSING STARTS, MARCH 2018 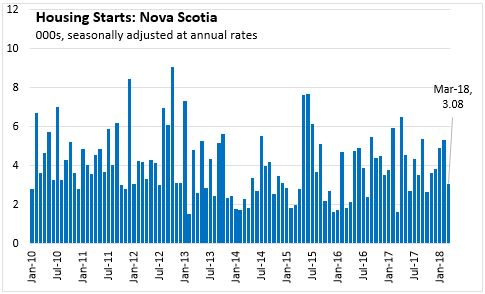
Nova Scotia's housing starts (seasonally adjusted annualized rate) decreased 42.3 per cent to 3,080 in March 2018 compared to 5,339 in February. The decline is reflected in the Halifax market, where housing starts decreased 59.8 per cent to 1,007 starts in March compared to 2,503 in February.
Compared to March 2017, Nova Scotia housing starts were up 88.1 per cent and Halifax starts were up 121.3 per cent.
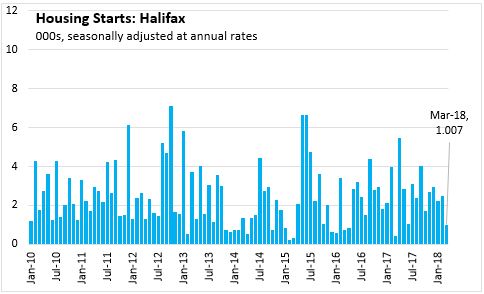
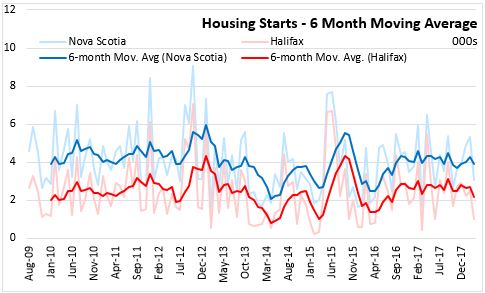
The six-month average of housing starts remained relatively flat in both Halifax and Nova Scotia through 2017 and into 2018, albeit with some variability month-to-month.

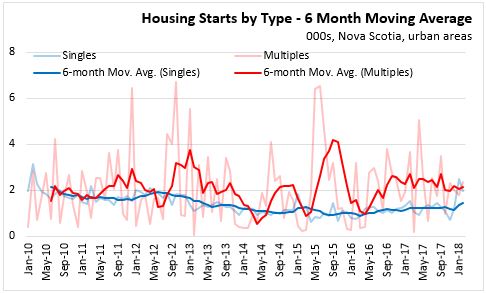
In urban areas, housing starts for multiples are generally higher than for singles with greater variability month-to-month. Starts for singles remained steady through 2017 and have increased in the first months of 2018. After increasing through mid-2016, starts for multiples have declined somewhat.
Nationally, housing starts declined 2.5 per cent in March 2018 to 225,213 compared to 231,026 in February. Compared to March 2017, housing starts were down 10.2 per cent.

Housing starts were up in four provinces in the first three months of 2018 compared to the same period in 2017. Newfoundland and Labrador reported the largest increase at +170.3 per cent. Manitoba posted the largest decline (-39.3 per cent), followed by Prince Edward Island (-27.5 per cent).

Note: Urban areas are defined as areas over 10,000 people
Statistics Canada: CANSIM table 027-0054, CANSIM table 027-0051.
CHMC Housing Market Information Portal
<--- Return to Archive