The Economics and Statistics Division maintains archives of previous publications for accountability purposes, but makes no updates to keep these documents current with the latest data revisions from Statistics Canada. As a result, information in older documents may not be accurate. Please exercise caution when referring to older documents. For the latest information and historical data, please contact the individual listed to the right.
<--- Return to Archive
For additional information relating to this article, please contact:
April 26, 2018EMPLOYMENT, EARNINGS AND HOURS, FEBRUARY 2018 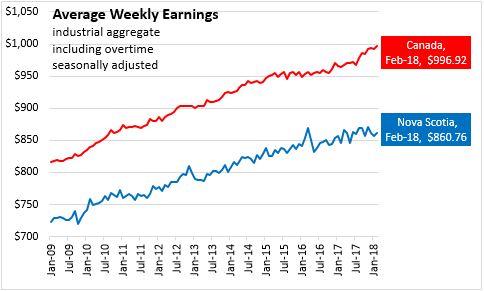
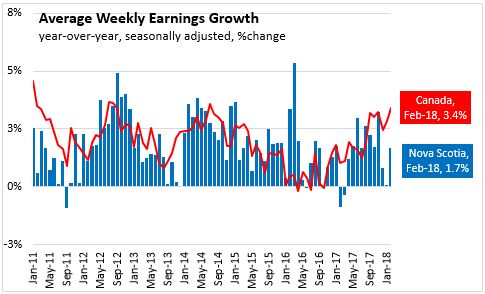
Nova Scotians' average weekly earnings (including overtime, seasonally adjusted) increased by $3.84 per week (0.4 per cent) from January 2018 to $860.76 in February. Average weekly wages increased 1.7 per cent over February of last year. Canadians' average weekly wages were up 0.4 per cent from January to $996.92 in February, up 3.4 per cent from last February.
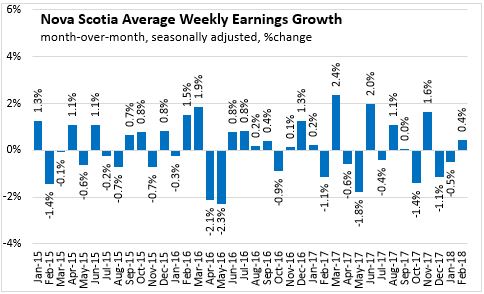
Changes in average weekly earnings reflect wage growth, changes in the composition of employment by industry/occupation/experience; and average hours worked per week.
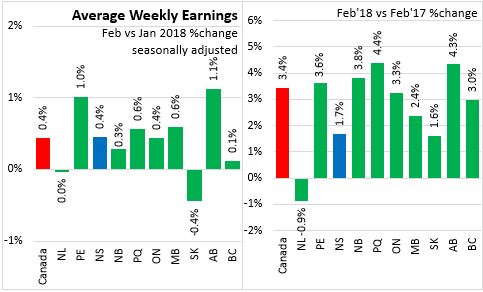
Across the country, monthly average weekly wages were up 0.4 per cent, reflecting increases in all but two provinces provinces. Comparing the latest results with February 2017, all provinces saw increases in average weekly earnings except Newfoundland and Labrador (-0.9 per cent). The largest increase in percentage terms was in Quebec (+4.4 per cent).
Year to date, average weekly earnings are up 3.1 per cent nationally, with all provinces except Newfoundland and Labrador reporting increases. Nova Scotia's average weekly earnings are up 0.9 per cent (YTD) compared to the first two months of 2017.

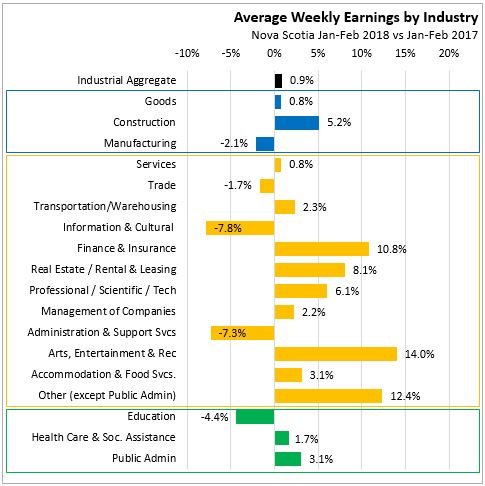
In the first two months of the year, average weekly earnings are up 0.8 per cent in Nova Scotia's goods producing sectors compared to January-February 2017. Growth in goods sector wages were led by the construction sector while manufacturing wages were down 2.1 per cent. Service sector earnings were also up 0.8 per cent, year to date. Service sector earnings increased the most in percentage terms in arts, entertainment and recreation, personal/repair (other services), and finance and insurance. There have been declines in average weekly earnings in informational and cultural services, administration and support services, education, and trade.
EMPLOYMENT
Nova Scotia had 412,971 payroll employees in February, the highest number number since March 2011. This represented a 0.7 per cent increase from last month, and a 2.2 per cent increase from last February. Canada had 16.5 million employees, up 0.3 per cent over last month and up 2.2 per cent compared to February 2017.

Nova Scotia's payroll employment has been generally trending upwards since 2014.

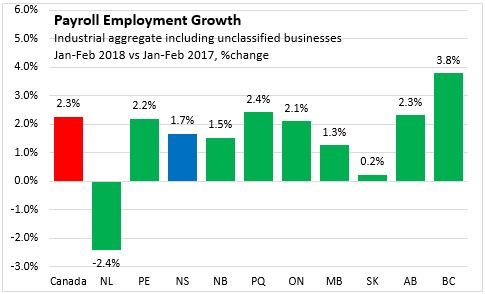
Year to date, payroll employment is up 2.3 per cent across Canada. The fastest payroll employment growth has been observed in British Columbia, Quebec, and Alberta. Nova Scotia's payroll employment is up 1.7 per cent (YTD) over the first two months of 2017.
REFERENCE TABLES - Year to Date (January-February 2018 vs. January-February 2017)

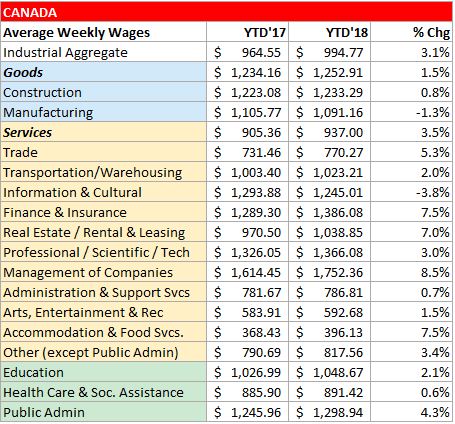
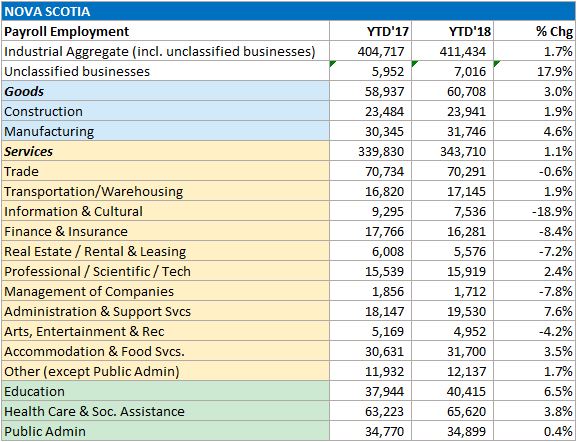
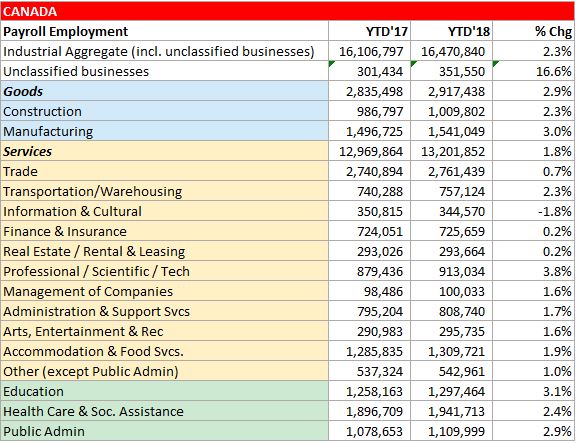
Source: Statistics Canada, Survey of Employment, Payroll, and Hours. CANSIM Table 281-0063, 281-0049
<--- Return to Archive