The Economics and Statistics Division maintains archives of previous publications for accountability purposes, but makes no updates to keep these documents current with the latest data revisions from Statistics Canada. As a result, information in older documents may not be accurate. Please exercise caution when referring to older documents. For the latest information and historical data, please contact the individual listed to the right.
<--- Return to Archive
For additional information relating to this article, please contact:
May 16, 2018MANUFACTURING SHIPMENTS, MARCH 2018 Nova Scotia
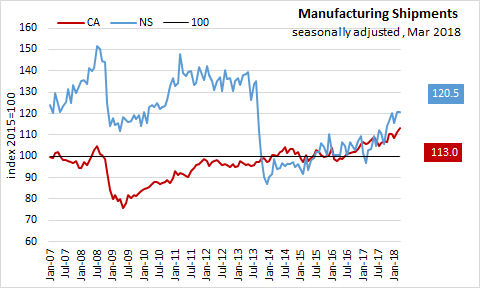
In Nova Scotia Mar 2018 seasonally adjusted Manufacturing Shipments decreased 0.1% to $773.8 million over Feb 2018, and increased 17.0% over Mar 2017.
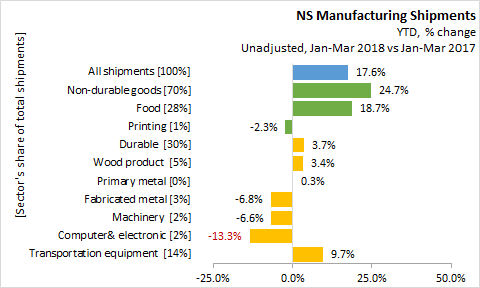
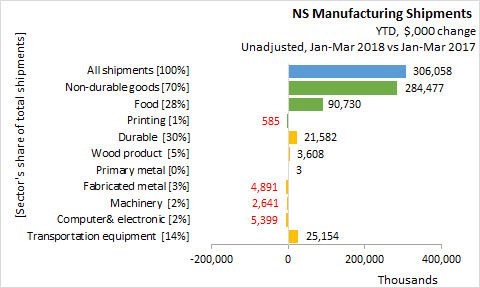
Unadjusted year-to-date (Jan-Mar 2018), All shipments increased 17.6% ($306.1 million) over the same period last year.
- Non-durable goods shipments, accounting for 70% of Manufacturing Shipments, increased 24.7% ($284.5 million),
- Food with a 28% share increased 18.7% ($90.7 million),
- Printing with a 1% share decreased 2.3% ($0.6 million).
- Durable manufacturing, accounting for 30% of Manufacturing Shipments, increased 3.7% ($21.6 million)
- Wood products with a 5% share increased 3.4% ($3.6 million)
- Primary metal with a 0.05% share increased 0.3% ($0.003 million)
- Fabricated metal with a 3% share decreased 6.8% ($4.9 million)
- Machinery with a 2% share decreased 6.6% ($2.6 million)
- Computer& electronic with a 2% share decreased 13.3% ($5.4 million)
- Transportation equipment with a 14% share increased 9.7% ($25.2 million)
CANADA
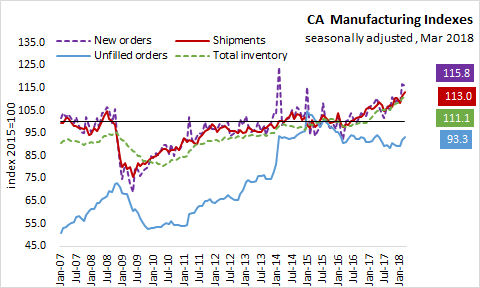
Canada seasonally adjusted manufacturing sales rose 1.4% to $57.1 billion in March 2018, and increased 6.4% over the same month last year. Compared to February 2018, overall sales increased in 13 of 21 industries as durable goods increased 2.2% and non-durable goods increased 0.4%.
The sales increase was led by increases of 4.2% to $4.4 billion in the primary metals industry. Sales were also up in the aerospace industry (+10.6% to $1.9 billion), fabricated metal products (+4.6% to $3.3 billion), and wood products (+3.7% to $3.0 billion).
Increased sales were partially offset by decreases in motor vehicles (-2.0% to $5.2 billion), machinery (-1.7%) to $3.2 billion) and computer and electronic products (-3.4% to $1.3 billion).
Inventory levels increased 0.7% in March 2018 to $79.3 billion. The Inventory to sales ratio decreased from 1.40 to 1.39. Unfilled orders increased 1.5% to $88.6 billion, and new orders decreased 0.7% to $58.5 billion over February 2018.
PROVINCES
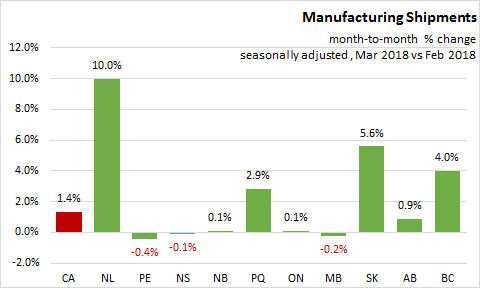
Manufacturing sales were up in seven provinces in March 2018. Newfoundland and Labrador had the largest month-over-month seasonally adjusted growth at 10.0%. Nova Scotia reported growth a decline of 0.1%. The Canadian average was 1.4%.
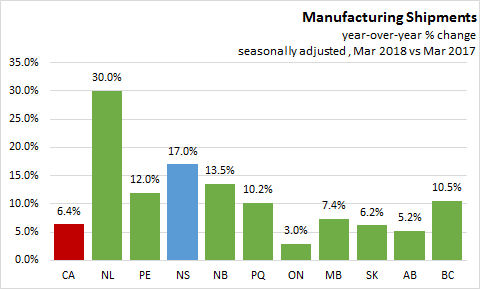
On a seasonally adjusted year-over-year basis, manufacturing shipments are up 6.4% in Canada, with all ten provinces recording positive year-over-year growth. Newfoundland and Labrador (+30.0%) reported the fastest growth. Nova Scotia reported manufacturing shipments increased 17.0% over March 2017.
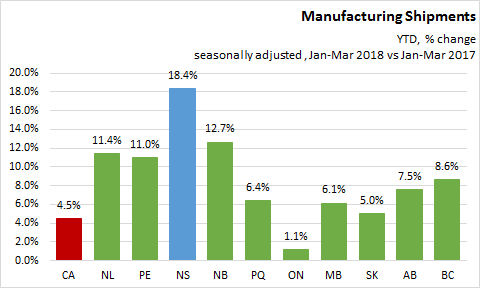
On a seasonally adjusted, year-to-date basis, manufacturing shipments growth was positive in all provinces. Canada reported +4.5% growth compared with the first three months of 2017. The largest gains were reported in Nova Scotia (+18.4%), with notable gains in New Brunswick (+12.7%), Newfoundland and Labrador (+11.4%) and Prince Edward Island (+11.0%).
UNADJUST
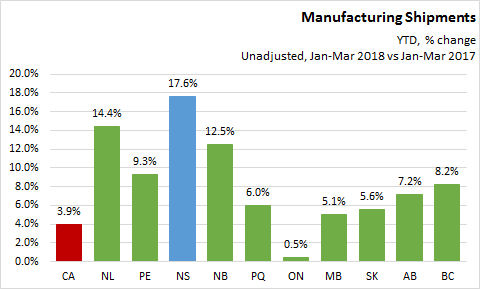
On an unadjusted year-to-date basis, manufacturing shipments growth was positive in all provinces. Canada reported +3.9% growth compared with the first three months of 2017. The largest gains were reported in Nova Scotia (+17.6%), with notable gains in Newfoundland (+14.4%), and New Brunswick (+12.5%).
STATISTICS CANADA QUOTES
"Sales were down in Manitoba, Nova Scotia and Prince Edward Island due to lower sales of durable goods."
SOURCES
Statistics Canada Manufacturing Shipments March 2018 and CANSIM 304-0015 and 304-0014
<--- Return to Archive