The Economics and Statistics Division maintains archives of previous publications for accountability purposes, but makes no updates to keep these documents current with the latest data revisions from Statistics Canada. As a result, information in older documents may not be accurate. Please exercise caution when referring to older documents. For the latest information and historical data, please contact the individual listed to the right.
<--- Return to Archive
For additional information relating to this article, please contact:
May 18, 2018RETAIL TRADE MARCH 2018 Month-over month
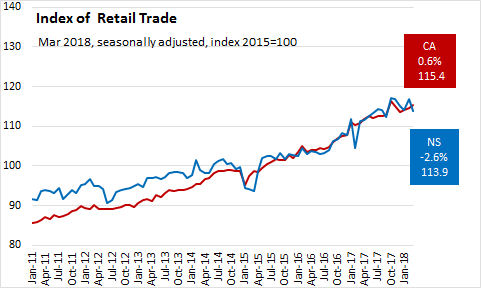
In March 2018, Nova Scotia's seasonally adjusted retail sales decreased 2.6% over February 2018 to $1.3 billion, and increased 2.3% over March 2017. The Nova Scotia retail trade index (2015=100) decreased to 113.9.
In Canada March 2018, seasonally adjusted retail sales increased 0.6% over February 2018 to $50.2 billion, and increased 4.1 per cent over March 2017. The Canada retail trade index (2015=100) increased to 115.4.
Canada and the Provinces
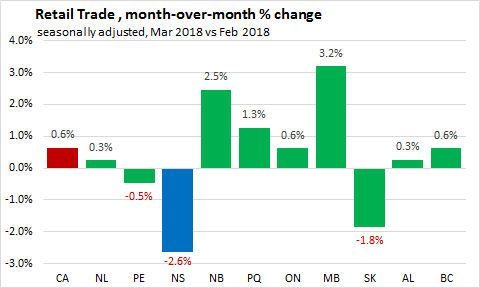
In March 2018, seven provinces reported month-over-month increases in seasonally adjusted retail sales. The other three provinces reported declines, including Nova Scotia (-2.6%), Saskatchewan (-1.8 per cent) and Prince Edwrd Island (-0.5 per cent). The Canadian average was +0.6% over February 2018.
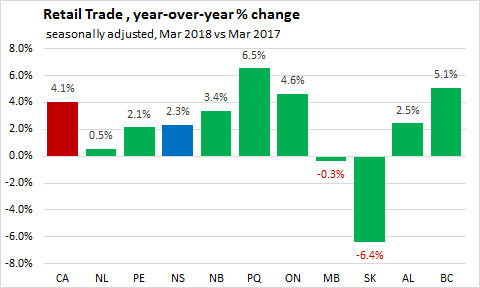
All provinces except Saskatchewan and Manitoba reported positive year-over year (Mar 2017 vs Mar 2018) retail sales growth. The largest gains were in Quebec (+6.5 per cent), British Columbia (+5.1 per cent), and Ontario (+4.6 per cent). Nova Scotia reported a 2.3% increase. The Canadian average was +4.1% year-over-year growth.
All provinces except Newfoundland and Labrador, Saskatchewan and Manitoba reported positive year-to-date retail sales growth (Jan-Mar 2018 vs Jan-Mar 2017) . The largest gains were in Prince Edward Island and Nova Scotia at 5.3 per cent each. The Canadian average was +3.5 per cent year-to-date growth.

Nova Scotia Sectors
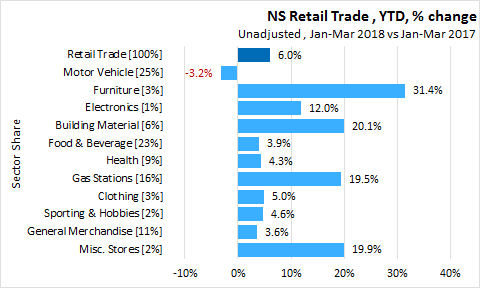
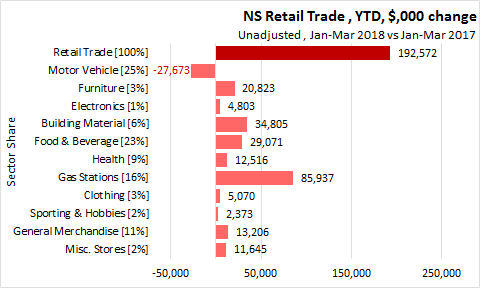
In Nova Scotia Jan-Mar 2018, unadjusted year-to-date Retail Trade increased 6.0% ($192.6 million) over Jan-Mar 2017 to $3.4 billion.
- Motor Vehicle with a 25% share of Retail Trade decreased 3.2% ($27.7 million).
- Furniture with a 3% share increased 31.4% ($20.8 million).
- Electronics with a 1% share increased 12.0% ($4.8 million).
- Building Material with a 6% share increased 20.1% ($34.8 million).
- Food & Beverage with a 23% share increased 3.9% ($29.1 million).
- Health with a 9% share increased 4.3% ($12.5 million).
- Gas Stations with a 16% share increased 19.5% ($85.9 million).
- Clothing with a 3% share increased 5.0% ($5.1 million).
- Sporting & Hobbies with a 2% share increased 4.6% ($2.4 million).
- General Merchandise with a 11% share increased 3.6% ($13.2 million).
- Misc. Stores with a 2% share increased 19.9% ($11.6 million).
E-Commerce
In March 2018, Canadian unadjusted retail e-commerce sales (2.59% of retail trade) increased 11.1 per cent to $1.268 billion compared to the same month last year.
Statistics Canada Cat. No. 63-005-X CANSIM 080-0020 and 080-0033
<--- Return to Archive