The Economics and Statistics Division maintains archives of previous publications for accountability purposes, but makes no updates to keep these documents current with the latest data revisions from Statistics Canada. As a result, information in older documents may not be accurate. Please exercise caution when referring to older documents. For the latest information and historical data, please contact the individual listed to the right.
<--- Return to Archive
For additional information relating to this article, please contact:
May 31, 2018COMPENSATION OF EMPLOYEES Q1 2018 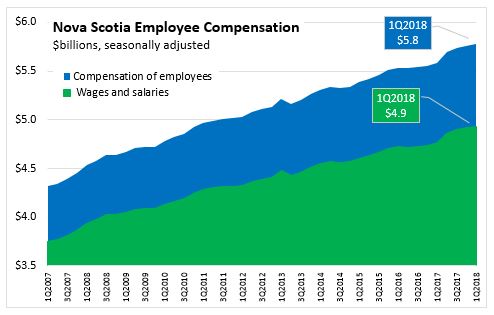
Nova Scotia's seasonally adjusted employee compensation (wages+salaries+employer social contributions) increased 0.2 per cent in the first quarter of 2018 to $5.77 billion. Compared to the first quarter of 2017 compensation was up 3.3 per cent. Compensation of employees has grown year-over-year by at least 3 per cent in the past four quarters.
The wages and salaries portion of employee compensation was up 0.1 per cent at $4.93 billion; an increase of 3.3 per cent over the same quarter in 2017. Employers' social contributions increased 0.8 per cent in the quarter and was 3.5 per cent higher than the first quarter 2017.

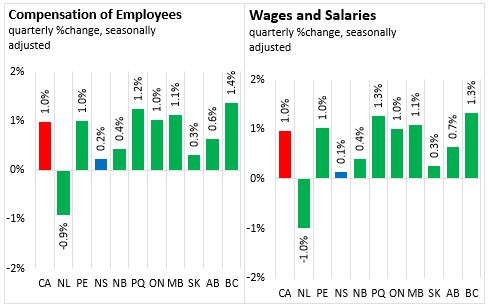
For the quarter, Canada's employee compensation was up 1.0 per cent as compensation increased in all provinces except Newfoundland and Labrador. The fastest growth for the month was in British Columbia at 1.4 per cent.
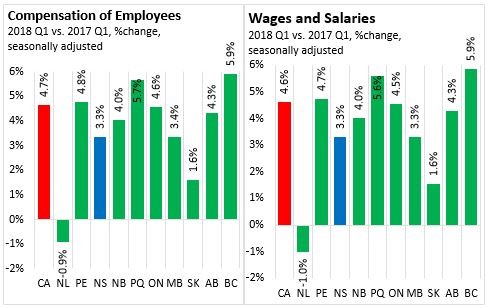
Comparing 2018 Q1 with 2017 Q1, Canada's employee compensation was up 4.7 per cent. The fastest growth was in British Columbia (+5.9%) and Quebec (+5.7%) while the slowest growth was reported in Newfoundland and Labrador (-0.9%) and Saskatchewan (+1.6%).
Comparing the seasonally unadjusted data for Q1 2018 with Q1 2017, total wages and salaries increased 3.2 per cent in Nova Scotia. The total wages and salaries paid in the goods sector rose by 2.1 per cent. Wages and salaries rose for utilities(+3.3%), manufacturing (+3.1%), construction (+1.4%) and agriculture, forestry and fishing (+0.8%) and declined in mining and oil and gas extraction (-2.1%).
Among private sector service sectors, growth was strongest in professional and personal services (+6.1%), followed by trade (+3.5%) and transportation and storage (+3.2%). Finance, real estate and company management reported growth of 0.3 per cent and there was a decline of 13.1 per cent in the total wages and salaries in the information and cultural industries.
All public and mixed public-private sectors reported wage and salary growth in Q1 2018 compared to Q1 2017. Educational services (+4.8%), health care and social assistance (5.2%), military (+3.6%) and local public administration (+4.4%) reported growth above the all industry average rate of 3.2 per cent. Growth for federal public administration was 1.8 per cent and provincial public administration was up 0.4 per cent.
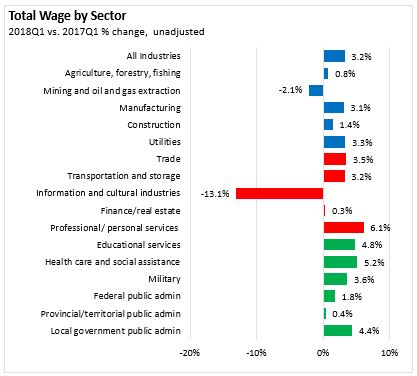
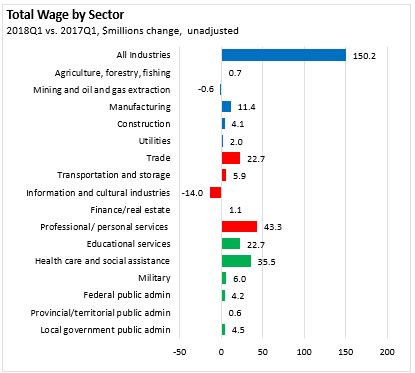
Note: comparison of wages and salaries by sector rely on data that are neither seasonally adjusted nor adjusted to reflect differences in pay periods from one year to the next.
Source: CANSIM table 382-0006
<--- Return to Archive