The Economics and Statistics Division maintains archives of previous publications for accountability purposes, but makes no updates to keep these documents current with the latest data revisions from Statistics Canada. As a result, information in older documents may not be accurate. Please exercise caution when referring to older documents. For the latest information and historical data, please contact the individual listed to the right.
<--- Return to Archive
For additional information relating to this article, please contact:
June 11, 2018BUSINESS AND EMPLOYMENT DYNAMICS IN CANADA, 2016 Statistics Canada has released the 2016 results for national business and employment dynamics. This covers incorporated and unincorporated businesses in the private sector that issue at least one T4 slip in any given calendar year, but excludes self-employed individuals or partnerships where the participants do not draw salaries.
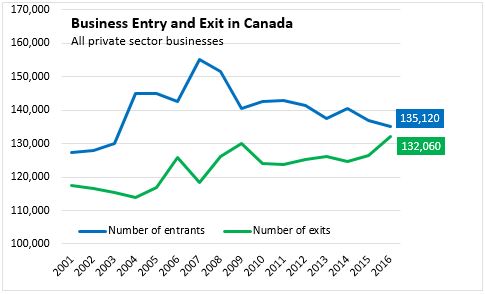
In 2016, there were a total of 1,110,630 active businesses in Canada, including 975,510 incumbents (continuing operations from previous years) as well as 135,120 new entrants. This was offset by exit of 132,060 firms from the numbers of previous incumbents. Entrants in any given year are enterprises that have current payroll data, but that did not have payroll data in the previous year. Similarly, exits in any given year are identified by the absence of current payroll data, where such data had existed in the previous year.
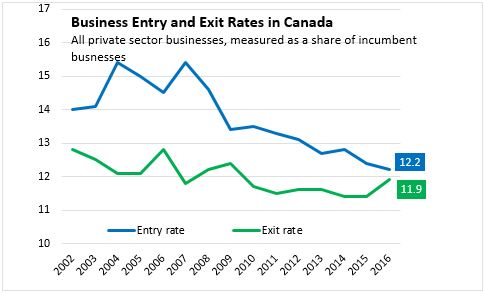
Measured in percentage terms (relative to an average of prior and current year totals), the entry rate for new firms was 12.2 per cent. The entry rate for firms has been mostly declining since the pre-recession peak. The exit rate for firms increased to 11.9 per cent in 2016, up from 11.4 per cent in 2015. Compared with the pre-recessionary period before 2008, but exit and entry rates are down for Canadian businesses.
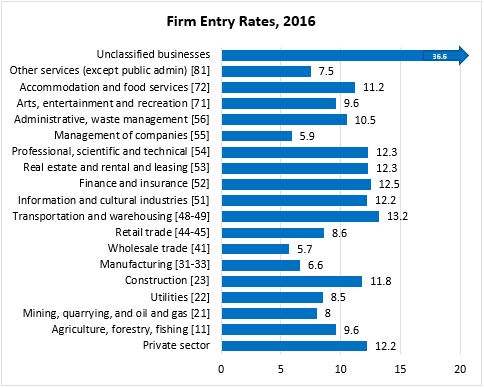
By sector, unclassified businesses accounded for a notably faster entry rate. Among classified sectors, the fastest entry rates were reported in transportation, information/culture, finance/insurance, real estate/rentals, professional/technical services and construction. Entry rates are slower for manufacturing, wholesale trade and company management (with some data quality limitations).
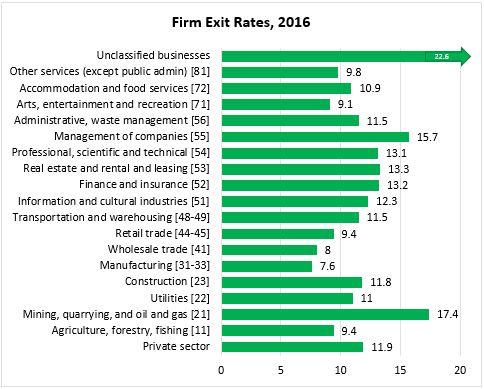
The fastest exit rates were also reported among unclassified businesses. Within those businesses classified to a sector, the fastest exit rates were reported in mining/oil/gas, company management (limited quality), real estate/rental, finance/insurance, professional/technical and information/culture. The slowest exit rates were observed in manufacturing, wholesale and arts/entertainment.
Statistics Canada's business employment dynamics data also examines employment changes in the private sector. In 2016, there was net private sector employment creation of 0.7 per cent in Canada - the slowest pace since 2010.
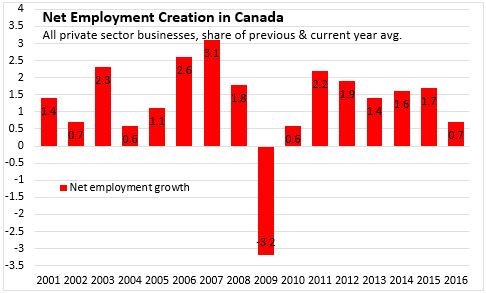
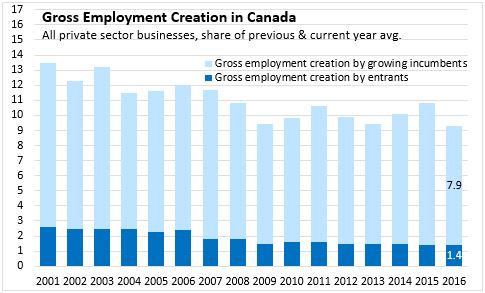
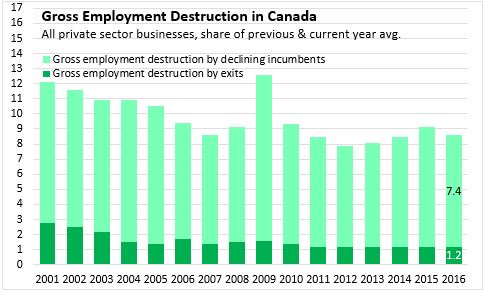
Net employment growth in 2016 is broken down into four subcomponents of gross employment creation and destruction: employment creation by entrants (1.4%), employment creation by growing incumbents (7.9%), employment destruction by exits (1.2%), and employment destruction by declining incumbents (7.4%).
In all years since 2000, most net private sector employment change is explained by employement creation or destruction by incumbents rather tham by new entrants or exiting firms.
Both gross employment creation and gross employment destruction trended up in 2013-2015 before both slowed in 2016, with creation slowing more than destruction. Employment turnover has been lower in the post-recessionary economy than it was prior to 2008.
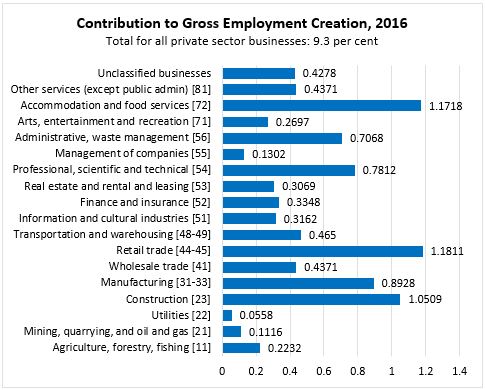
The contribution that each sector makes to overall employment dynamics depends on its share of overall employment and its gross employment creation or destruction. Sectors such as manufacturing, retail, wholesale, finance/insurance and accommodation/food account for a larger share of total employment than their share of active businesses.
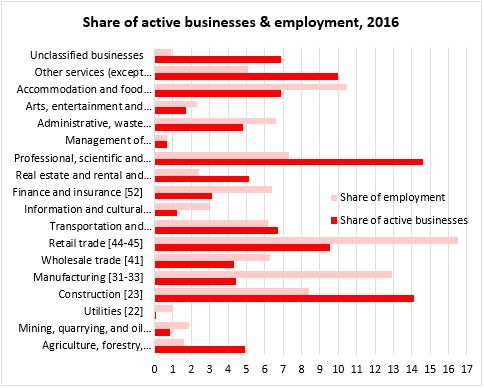
The largest contributions to gross employment creation in 2016 came from accommodation/food, retail trade, construction and manufacturing employers.
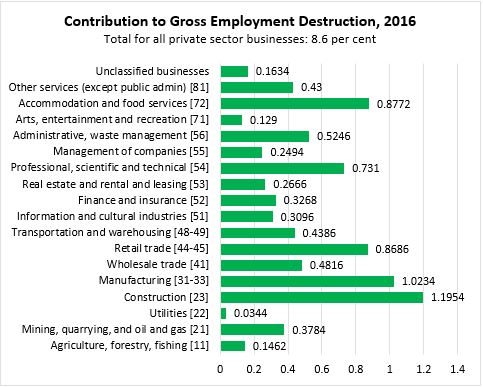
The largest contributions to gross employment destruction in 2016 were reported among the same four sectors that accounted for the most employment creation, but construction and manufacturing reported net employment declines while accommodation/food and retail trade reported net employment increases.
Statistics Canada. Table 33-10-0164-01 Business Dynamics measures, by industry
<--- Return to Archive