The Economics and Statistics Division maintains archives of previous publications for accountability purposes, but makes no updates to keep these documents current with the latest data revisions from Statistics Canada. As a result, information in older documents may not be accurate. Please exercise caution when referring to older documents. For the latest information and historical data, please contact the individual listed to the right.
<--- Return to Archive
For additional information relating to this article, please contact:
July 06, 2018NOVA SCOTIA - INTERNATIONAL MERCHANDISE TRADE MAY 2018 Year-to-Date (Jan-May 2018 vs. Jan-May 2017, customs-based, unadjusted)
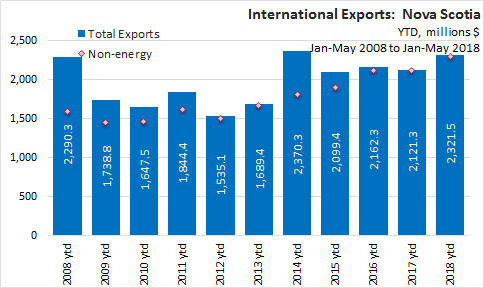
In Jan-May 2018, Nova Scotia merchandise trade exports increased $200.2 million (9.4 per cent) over Jan-May 2017 to $2.3 billion.
YTD - By Sector
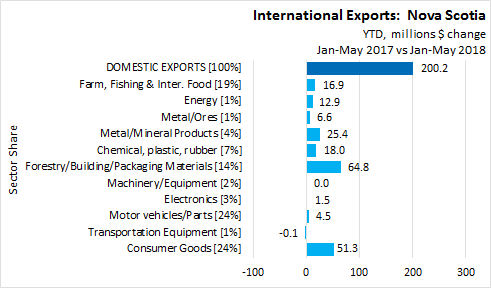
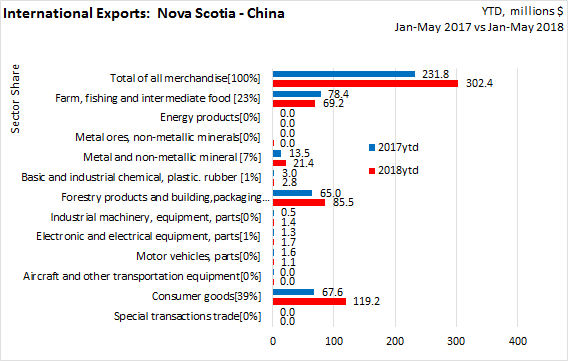
Comparing Nova Scotia's exports for Jan-May 2018 with the same period in 2017, the largest dollar value increase were in forestry (+$64.8 million), consumer goods (+$51.3 million), and Metal/Mineral Products (+$25.4 million). Energy products were up $12.9 million, but now make up a relatively small portion of Nova Scotia's exports.
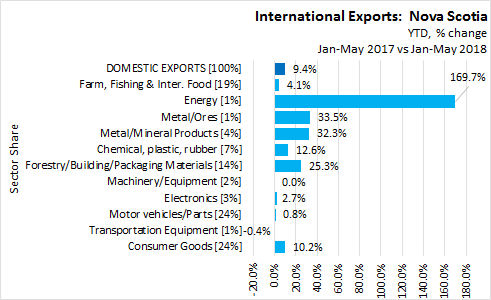
On a year-to-date basis, exports values increased in:
- Forestry products and building and packaging materials by 25.3% ($64.8 million)
- Farm, fishing and intermediate food products by 4.1% (+$16.9 million)
- Metal and non-metallic mineral products by 32.3% ($25.4 million)
- Basic and industrial chemical, plastic and rubber products by 12.6% (+$18.0 million)
- Motor vehicles and parts by 0.8% (+$4.5 million)
- Consumer goods by 10.2% (+$51.3 million)
- Energy products by 169.7% (+$12.9 million)
- Metal/Ores by 33.5% (+$6.6 million)
- Electronic and electrical equipment and parts by 2.7% (+$1.5 million).

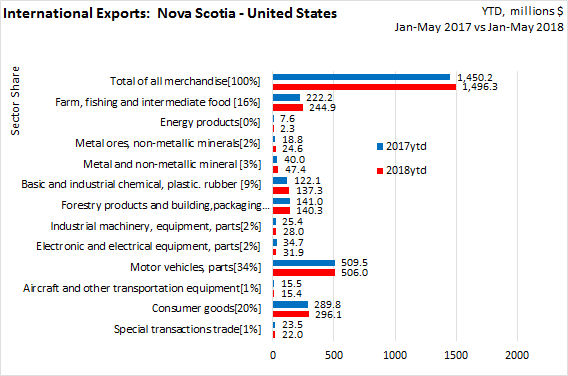
In Jan-May 2018, the United States share of Nova Scotia domestic exports declined 4 points to 64% over the same period last year.
In Jan-May 2018, the China share of Nova Scotia domestic exports increased 2 points to 13% over the same period last year.
YTD by Province
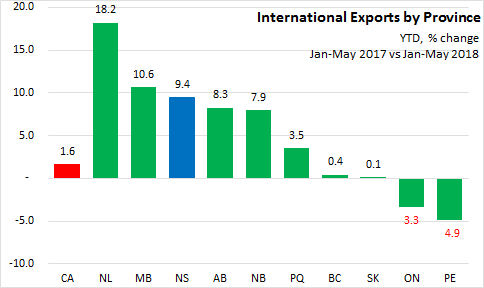
In Jan-May 2018, Newfoundland and Labrador reported the highest increase (+18.2%) in merchandise trade exports over Jan-May 2017. Nova Scotia reported a +9.4% gain in merchandise trade exports. The Canadian average was a 1.6% increase in merchandise trade exports over Jan-May 2017. Exports were down in Ontario (-3.3%) and Prince Edward Island (-4.9%) over the same period last year.
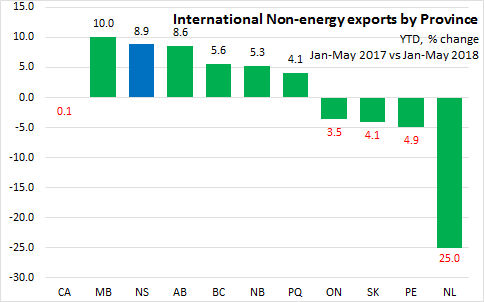
Excluding energy exports, Manitoba reported the fastest growth at 10.0%, followed by Nova Scotia at 8.9%. Newfoundland and Labrador's non-energy exports were down 25.0% while Ontario, Saskatchewan and Prince Edward Island were down 3.5%, 4.1% and 4.9% respectively.
Statistics Canada.
Table 12-10-0001-01 International merchandise trade by commodity (x 1,000,000)
12-10-0002-01 International merchandise trade by province and commodity (x 1,000,000)
12-10-0012-01 International merchandise trade by province, commodity, and Principal Trading Partners (x 1,000)
12-10-0099-01 Merchandise imports and exports, customs-based, by Harmonized commodity description and coding system (HS) section, Canada, provinces and territories, United States, states (x 1,000)
<--- Return to Archive