The Economics and Statistics Division maintains archives of previous publications for accountability purposes, but makes no updates to keep these documents current with the latest data revisions from Statistics Canada. As a result, information in older documents may not be accurate. Please exercise caution when referring to older documents. For the latest information and historical data, please contact the individual listed to the right.
<--- Return to Archive
For additional information relating to this article, please contact:
July 10, 2018CMHC PRELIMINARY HOUSING STARTS, JUNE 2018 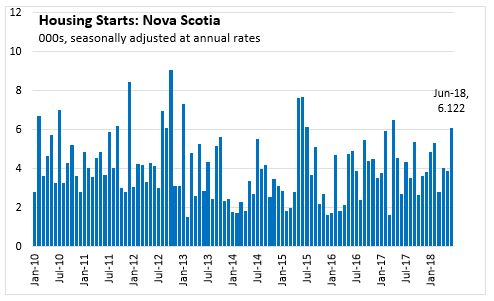
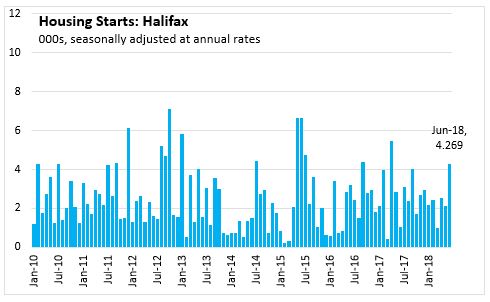
Nova Scotia's housing starts (seasonally adjusted annualized rate) increased 57.2 per cent in June to 6,122 compared to 3,895 in May. Housing starts increased by 100.3 per cent in Halifax to 4,269 compared to 2,131 in May.
Compared to June 2017, Nova Scotia housing starts were up 127.1 per cent, and Halifax starts were up 314.5 per cent.
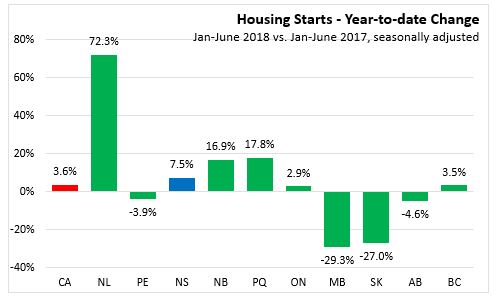
In the first half of 2018, housing starts were up 7.5 per cent in Nova Scotia compared to the same period in 2017. This reflects a decline in multiple-unit starts in population centres with over 10,000 people.
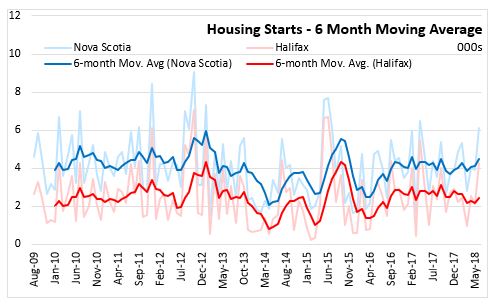
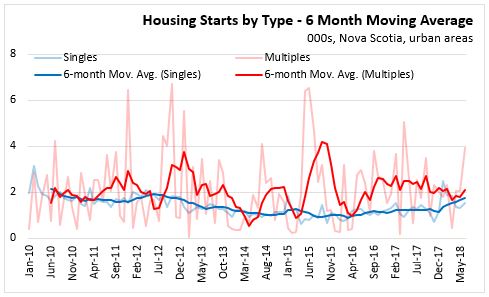
The six-month average of housing starts has remained relatively flat in both Halifax and Nova Scotia through 2017 and into 2018, albeit with some variability month-to-month.
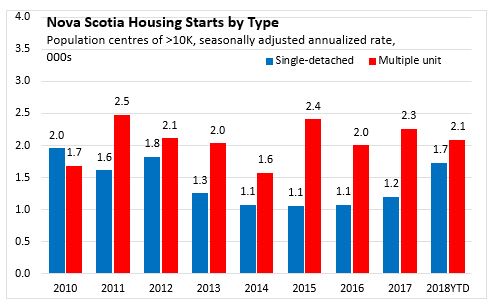
In urban areas, housing starts for multiples are generally higher than for singles with greater variability month-to-month. Starts for singles remained steady through 2017 and have increased in the first half of 2018. After increasing through mid-2016, starts for multiples have declined somewhat.
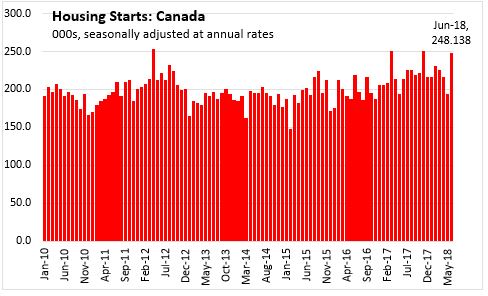
Nationally, housing starts are up 28.0 per cent in June to 248,138 compared to 193,902 in May. Compared to May 2017, housing starts were up 16.3 per cent.
On a year-to-date basis, housing starts were up in six provinces compared to the first half of 2017. Newfoundland and Labrador reported the largest increase (+72.3 per cent), while Manitoba posted the largest decline (-29.3 per cent).
Note: Urban areas are defined as areas over 10,000 people
Statistics Canada: CANSIM table 027-0054, CANSIM table 027-0051.
CHMC Housing Market Information Portal
<--- Return to Archive