The Economics and Statistics Division maintains archives of previous publications for accountability purposes, but makes no updates to keep these documents current with the latest data revisions from Statistics Canada. As a result, information in older documents may not be accurate. Please exercise caution when referring to older documents. For the latest information and historical data, please contact the individual listed to the right.
<--- Return to Archive
For additional information relating to this article, please contact:
August 16, 2018MANUFACTURING SHIPMENTS, JUNE 2018 Nova Scotia
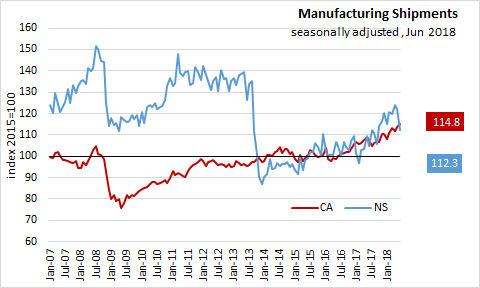
In Nova Scotia Jun 2018, seasonally adjusted Manufacturing Shipments decreased 8.2% to $721.4 million over May 2018, and increased 7.4% over Jun 2017.
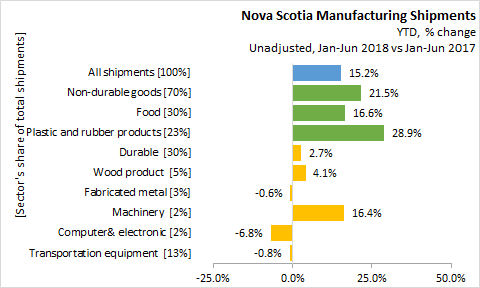
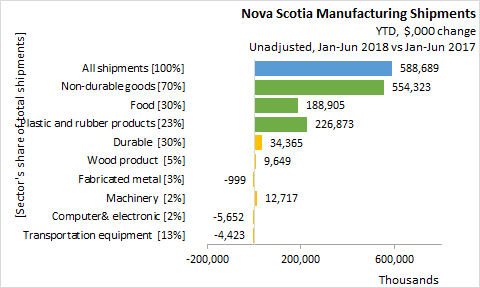
Unadjusted year-to-date (Jan-Jun 2018), Manufacturing Shipments increased 15.2% ($588.7 million) over the same period last year.
- Non-durable goods shipments, accounting for 70% of Manufacturing Shipments, increased 21.5% ($554.3 million),
- Food with a 30% share increased 16.6% ($188.9 million),
- Plastic and rubber products with a 23% share increased 28.9% ($226.9 million).
- Durable manufacturing, accounting for 30% of Manufacturing Shipments, increased 2.7% ($34.4 million)
- Wood product with a 5% share increased 4.1% ($9.6 million)
- Fabricated metal with a 3% share decreased 0.6% (-$1.0 million)
- Machinery with a 2% share increased 16.4% ($12.7 million)
- Computer& electronic with a 2% share decreased 6.8% (-$5.7 million)
- Transportation equipment with a 13% share decreased 0.8% (-$4.4 million)
CANADA
Canada seasonally adjusted manufacturing sales increased 1.1% to $58.1 billion in June 2018, and increased 6.9% over the same month last year.
Sales of petroleum and coal products increased 15.9% in June. Fabricated metal (+3.0%) and the plastics and rubber (+2.2%) product industries also reported large gains. Sales of chemical products were down 4.5%. Sales of food products were also down 1.7%.
Primary metal sales edged down 0.3% to $4.6 billion after the United States tariffs on Canadian steel and aluminum products that came into effect on June 1, 2018.
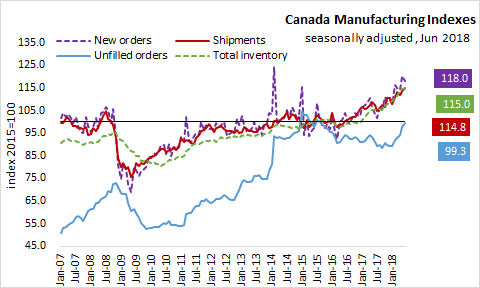
Inventory levels increased 0.5% growth in June 2018 to $82.1 billion. The inventory to sales ratio decreased from 1.42 to 1.41. Unfilled orders increased for the fifth consecutive month with an increase of 1.7% to $94.3 billion mostly due to aerospace product and parts industry. New orders decreased 1.8%.
PROVINCES
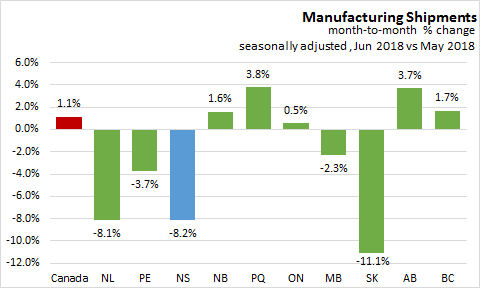
On a seasonally adjusted, month-over-month basis, Manufacturing sales increased in 5 provinces in Jun 2018 over May 2018. Quebec had the largest growth at 3.8 per cent, while Saskatchewan had the sharpest decline at 11.1per cent. Nova Scotia reported negative growth of 8.2 per cent.
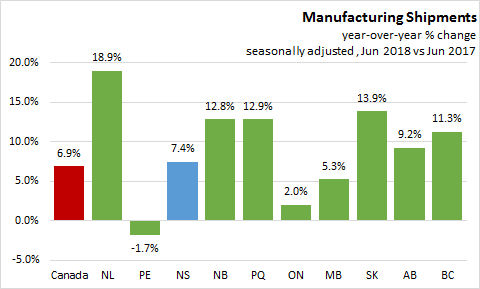
On a seasonally adjusted year-over-year basis, manufacturing shipments are up 6.9% in Canada, with nine provinces recording positive year-over-year growth.
Manufacturing shipments were 18.9% higher in Newfoundland Labrador over June 2017. Prince Edward Island manufacturing shipments are down 1.7%. Nova Scotia shipments increased 7.4% over June 2017.
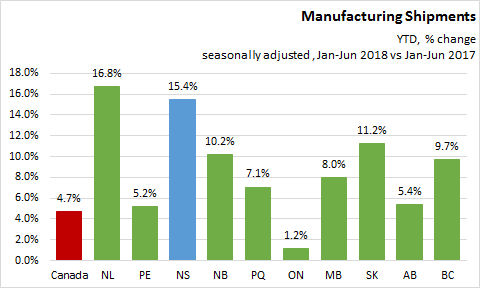
On a seasonally adjusted, year-to-date basis, manufacturing shipments growth was positive in all provinces.
Canada reported +4.7% growth compared with the first six months of 2017. The largest gains was reported in Newfoundland and Labrador (16.8%) and Ontario reported the lowest six-month increase (1.2%). Nova Scotia seasonally adjusted year-to-date growth was 15.4% over Jan-Jun 2017.
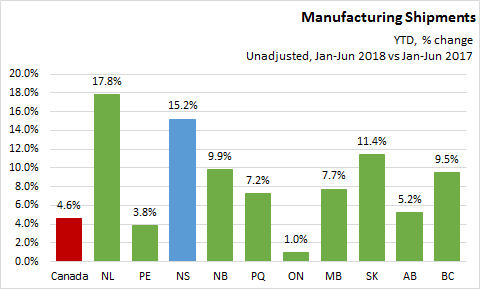
YEAR-TO-DATE UNADJUST DATA
On an unadjusted year-to-date basis, manufacturing shipments growth was positive in all provinces. Canada reported +4.6% growth and Nova Scotia was up 15.2 per cent. Newfoundland and Labrador recorded the greatest increase (17.8%) and Ontario the lowest year-to-date increase (1.0%) over Jan-Jun 2017.
STATISTICS CANADA QUOTE
"Nova Scotia (-8.2%) posted the second largest provincial decrease in June, partly due to lower sales in the seafood product preparation and packaging industry."
SOURCES
Statistics Canada Manufacturing Shipments May 2018
Table 16-10-0047-01 Manufacturers' sales, inventories, orders and inventory to sales ratios, by industry (dollars unless otherwise noted)
Table 16-10-0048-01 Manufacturing sales by industry and province, monthly (dollars unless otherwise noted) (x 1,000)
<--- Return to Archive