The Economics and Statistics Division maintains archives of previous publications for accountability purposes, but makes no updates to keep these documents current with the latest data revisions from Statistics Canada. As a result, information in older documents may not be accurate. Please exercise caution when referring to older documents. For the latest information and historical data, please contact the individual listed to the right.
<--- Return to Archive
For additional information relating to this article, please contact:
August 22, 2018RETAIL TRADE, JUNE 2018 Month-over month
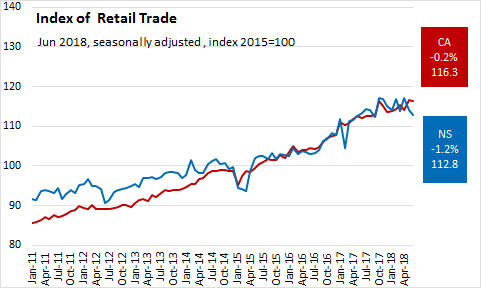
In Nova Scotia June 2018, seasonally adjusted Retail Trade decreased 1.2% over May 2018 to $1.3 billion. Jun 2018 vs Jun 2017, seasonally adjusted Retail Trade decreased 0.6%.
Nationally, June 2018, seasonally adjusted Retail Trade decreased 0.2% over May 2018 to $50.7 billion. Jun 2018 vs Jun 2017, seasonally adjusted Retail Trade increased 3.8%.
Canada and the Provinces
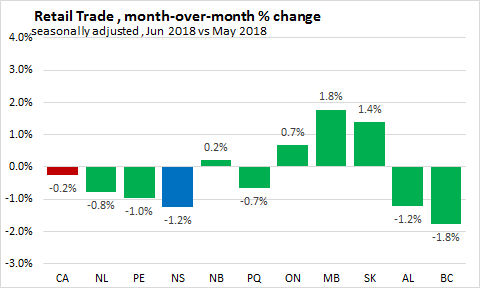
On a month over month basis, seasonally adjusted Retail Trade decreased 0.2% nationally. Four provinces reported monthly increases in retail trade, with Manitoba (1.8 %) reporting the largest gain. Nova Scotia reported a decline (-1.2 %) over the previous month. British Columbia reported the largest decline (-1.8 %).
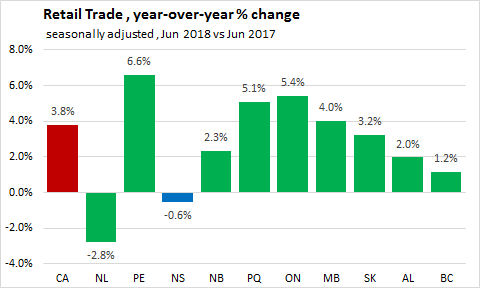
On a year over year basis, seasonally adjusted Retail Trade increased 3.8% nationally. Eight provinces reported year-over-year increases in retail trade, with Prince Edward Island (6.6 %) reporting the largest gain. Nova Scotia reported a decline (-0.6 %) over the same month last year. Newfoundland and Labrador reported the largest decline (-2.8 %).
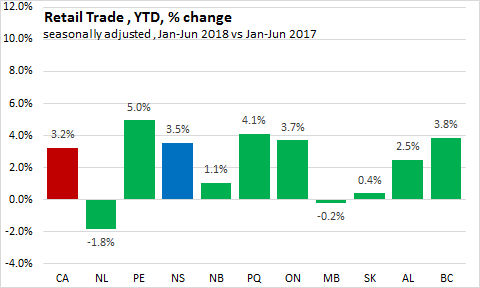
On a year to date basis, seasonally adjusted Retail Trade increased 3.2% nationally. Eight provinces reported year-over-year increases in retail trade, with Prince Edward Island (5.0 %) reporting the largest gain. Nova Scotia reported an increase (3.5 %) over the same period last year. Newfoundland and Labrador reported the largest decline (-1.8 %).
Nova Scotia Sectors
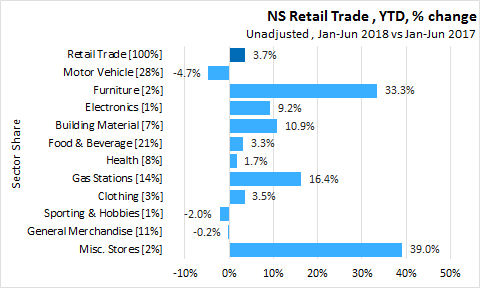
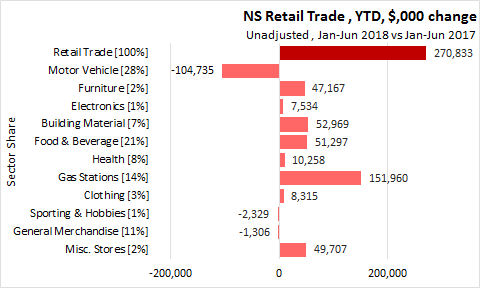
Unadjusted year-to-date (Jan-Jun 2018), Retail Trade increased 3.7% ($270.8 million) over Jan-Jun 2017 to $7.7 billion.
- Motor Vehicle with a 28% share of Retail Trade decreased 4.7% (-$104.7 million).
- Furniture with a 2% share increased 33.3% ($47.2 million).
- Electronics with a 1% share increased 9.2% ($7.5 million).
- Building Material with a 7% share increased 10.9% ($53.0 million).
- Food & Beverage with a 21% share increased 3.3% ($51.3 million).
- Health with an 8% share increased 1.7% ($10.3 million).
- Gas Stations with a 14% share increased 16.4% ($152.0 million).
- Clothing with a 3% share increased 3.5% ($8.3 million).
- Sporting & Hobbies with a 1% share decreased 2.0% (-$2.3 million).
- General Merchandise with a 11% share decreased 0.2% (-$1.3 million).
- Misc. Stores with a 2% share increased 39.0% ($49.7 million).
Source: Statistics Canada Tables 20-10-0008-01 and 20-10-0072-01
<--- Return to Archive