The Economics and Statistics Division maintains archives of previous publications for accountability purposes, but makes no updates to keep these documents current with the latest data revisions from Statistics Canada. As a result, information in older documents may not be accurate. Please exercise caution when referring to older documents. For the latest information and historical data, please contact the individual listed to the right.
<--- Return to Archive
For additional information relating to this article, please contact:
September 05, 2018NOVA SCOTIA - INTERNATIONAL MERCHANDISE TRADE JULY 2018 Year-to-Date (Jan-Jul 2018 vs. Jan-Jul 2017, customs-based, unadjusted)
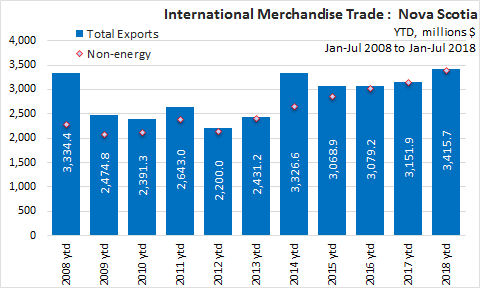
In Jan-Jul 2018, Nova Scotia International Merchandise Trade Exports increased 8.4% ($263.8 million) over Jan-Jul 2017, to $3.4 billion.
YTD - By Sector
Comparing Nova Scotia's exports for Jan-Jul 2018 with the same period last year, the largest dollar value increases were in Forestry ($105.1 million), Consumer goods ($31.7 million) and Rubber Products ($29.5 million). Energy increased 210.0% but now makes up a relatively small portion of Nova Scotia's exports.
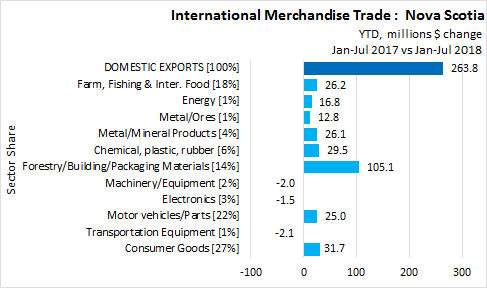
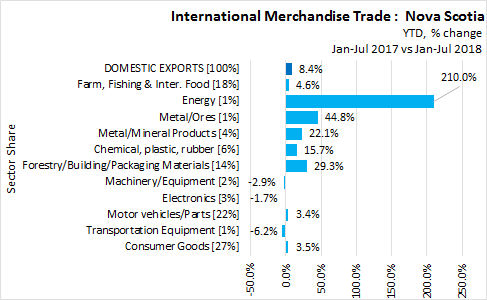
On a year-to-date basis, export values increased in
- Forestry/Building/Packaging Materials by 29.3% ($105.1) million)
- Consumer Goods by 3.5% ($31.7) million)
- Chemical, plastic, rubber by 15.7% ($29.5) million)
- Farm, Fishing & Inter. Food by 4.6% ($26.2) million)
- Metal/Mineral Products by 22.1% ($26.1) million)
- Motor vehicles/Parts by 3.4% ($25.0) million)
- Energy by 210.0% ($16.8) million)
- Metal/Ores by 44.8% ($12.8) million)
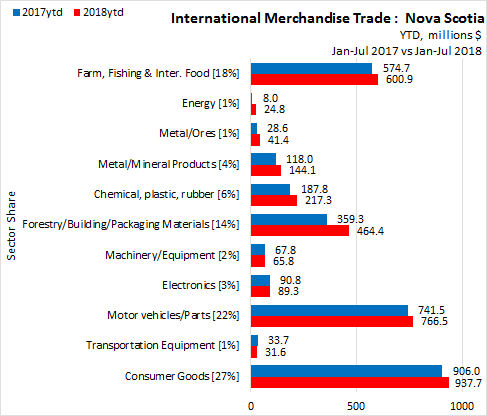
In Jan-Jul 2018, Consumer goods led the way with a value of $937.7 million. Motor vehicles and parts is the second largest commodity group in Nova Scotia at $766.5 million. Number three is Farm, fishing and Intermediate Food at $600.9 million. The fourth largest is Forestry, Building and Packaging Materials sector at $464.4 million. Together, these four sectors account for 81% of Nova Scotia domestic exports.
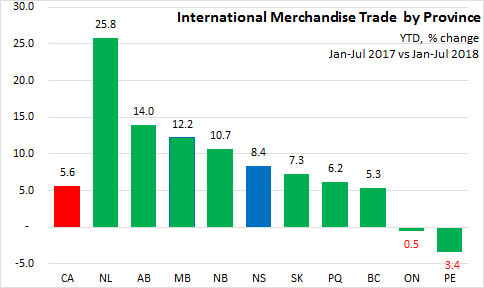
YTD by Province
In Jan-Jul 2018, Newfoundland and Labrador reported the highest increase (+25.8%) in merchandise trade exports over Jan-Jul 2017. Nova Scotia reported a +8.4% gain in merchandise trade exports. The Canadian average was a 5.6% increase in merchandise trade exports over Jan-Jul 2017. Exports were down in Ontario (-0.5%) and Prince Edward Island (-3.4%) over the same period last year.
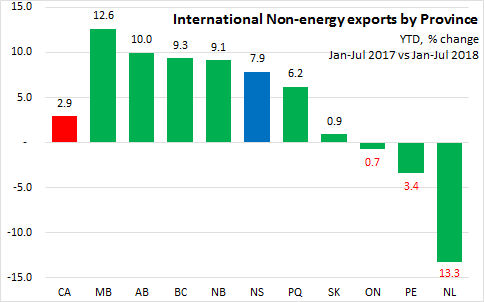
Excluding energy exports, Manitoba reported the fastest growth at 12.6%, followed by Alberta at 10.0%. Three provinces (Ontario, Prince Edward Island and Newfoundland and Labrador) were down 0.7%, 3.4% and 13.3% respectively. Canada reported a 2.9% increase in Non-energy exports.
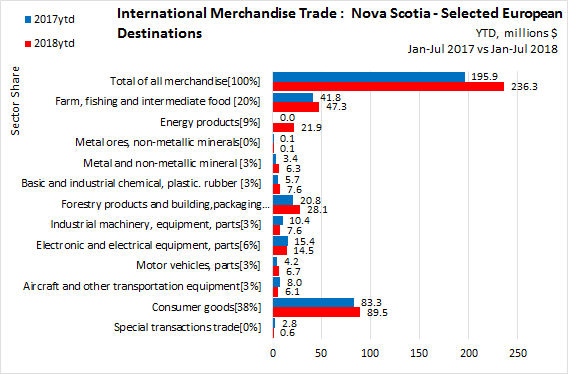
YTD Exports by International Destination
Nova Scotia’s trade continues to diversity. Although exports to the US grew by 4.2 per cent or +$86 million (YTD Jan-Jul18 vs Jan-Jul17). This is slower than the overall pace of export growth (8.4%), indicating that the province’s exports are growing more rapidly in other jurisdictions. Nova Scotia’s exports to China are up by 24.7 per cent or +$91 million in the same period. Exports to other markets in Asia are down (11.4%) after sharp increases last year, up 20.6% in selected European countries.

In Jan-Jul 2018, the United States share of Nova Scotia domestic exports declined 3 points to 63% over the same period last year.
In Jan-Jul 2018, the China share of Nova Scotia domestic exports increased 1 points to 13% over the same period last year.
In Jan-Jul 2018, other major Asian (Japan, South Korea, Hong Kong, India, Indonesia, Sinapore) share of Nova Scotia domestic exports decreased 2 points to 7% over the same period last year.

In Jan-Jul 2018, major Europen countries share of Nova Scotia domestic exports increased 1 point to 7% over the same period last year. (United Kingdom, Germany, Italy, France, Netherlands, Belgium, Spain )
Statistics Canada.
Table 12-10-0001-01 International merchandise trade by commodity (x 1,000,000)
12-10-0002-01 International merchandise trade by province and commodity (x 1,000,000)
12-10-0012-01 International merchandise trade by province, commodity, and Principal Trading Partners (x 1,000)
12-10-0099-01 Merchandise imports and exports, customs-based, by Harmonized commodity description and coding system (HS) section, Canada, provinces and territories, United States, states (x 1,000)
<--- Return to Archive