The Economics and Statistics Division maintains archives of previous publications for accountability purposes, but makes no updates to keep these documents current with the latest data revisions from Statistics Canada. As a result, information in older documents may not be accurate. Please exercise caution when referring to older documents. For the latest information and historical data, please contact the individual listed to the right.
<--- Return to Archive
For additional information relating to this article, please contact:
September 14, 2018NATIONAL BALANCE SHEET ACCOUNTS, Q2 2018 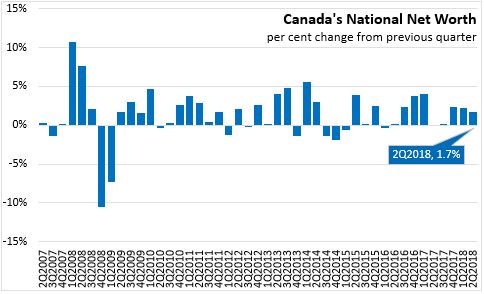
In the second quarter of 2018, Canadian national net worth increased 1.7 per cent (or $194.0 billion) to $11,638 billion. Canada's net foreign asset position decreased by $15.1 billion to $518.7 billion in Q2 reflecting net borrowings of $10.4 billion from international financial transactions to finance the current account deficit. The relatively strong performance of the Canadian stock market also contributed to this quarter's decline.
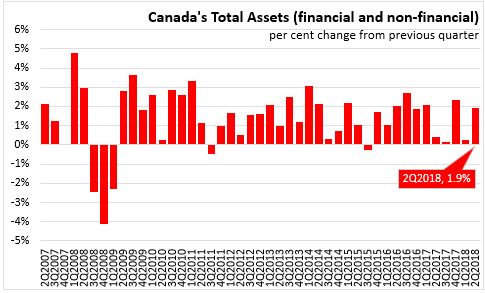
Total assets, including financial and non-financial assets increased by 1.9 percent to $37.6 trillion at the end of the second quarter 2018. Total financial assets also increased by 1.9 per cent.
Household sector
In the second quarter 2018, Canada’s household sector net worth at market value increased 1.1 per cent to $11.1 trillion. Non-financial assets grew mainly due to growth in the value of residential real estate, which has been growing at a slower pace due to moderate housing resale prices. Financial assets increased after a decline in the first quarter. Equity and investment funds increased this quarter.
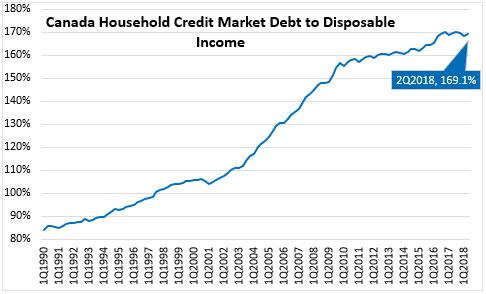
Household borrowing slowed for the second consecutive quarter in Q2 with $19.6 billion borrowed compared to $22.2 billion in the previous quarter. The increase in consumer credit more than offset the decline in mortgage and non-mortgage borrowing. Total household credit market debt (consumer credit, mortgage and non-mortgage loans) was $2,166.0 billion and as share of disposable income increased from 168.3% to 169.1%.
Government sector
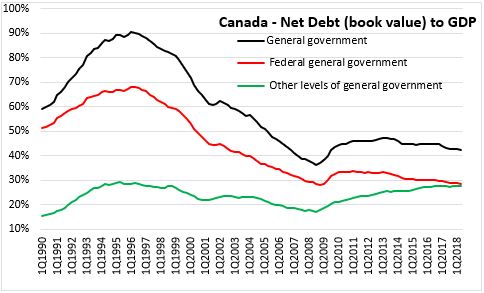
At the end of the second quarter 2018, general government net debt (book value) declined to 42.5 percent of GDP, compared to 42.92 per cent in the previous quarter. The federal government's net debt to GDP ratio decreased from 28.78 to 28.45 per cent, while other levels of government saw an increase in net debt to GDP to 27.87 per cent from 27.75 per cent in the previous quarter.
Corporate sector
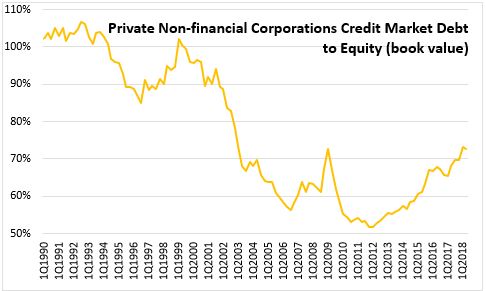
The credit market debt to equity ratio of non-financial private corporations was 72.61 cents of credit market debt for every dollar of equity in the second quarter 2018, down from 73.19 cents in the previous quarter. Demand for funds by non-financial private corporations was $41.1 billion in the second quarter - the highest value since 2017Q2 when significant mergers and acquisition activity occurred. This majority of this quarter's financing was provided by the banking sector in the form of non-mortgage loans.
Statistics Canada: National Balance Sheet and financial flow accounts
<--- Return to Archive