The Economics and Statistics Division maintains archives of previous publications for accountability purposes, but makes no updates to keep these documents current with the latest data revisions from Statistics Canada. As a result, information in older documents may not be accurate. Please exercise caution when referring to older documents. For the latest information and historical data, please contact the individual listed to the right.
<--- Return to Archive
For additional information relating to this article, please contact:
October 02, 2018NOVA SCOTIA INTERPROVINCIAL TRADE REAL 2007$ INTERPROVINCIAL TRADE COMPONENTS
In 2016 Nova Scotia’s total external trade markets were valued at $35.6 billion (real 2007$). Interprovincial trade represented 52% of this external trade activity, and international trade represented the other 48%.
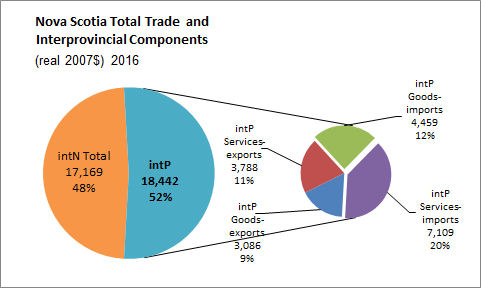
In 2016 Nova Scotia exported and/or imported $18.4 billion (real 2007$) worth of goods and services in its interprovincial trade market.
Interprovincial services imports are the largest component of Nova Scotia’s external trade at $7.109 billion (real 2007$), this was up 3.8 per cent ($257 million) from 2015 totals. Interprovincial services imports share of interprovincial trade is 20 per cent of all Nova Scotia external trade.
Interprovincial goods imports are the second largest component of Nova Scotia’s external trade at $4.459 billion (real 2007$), this was up 4.5 per cent ($192 million) from 2015 totals. Interprovincial goods imports are 12 per cent of all Nova Scotia external trade.
Interprovincial services exports are the third largest component of Nova Scotia’s external trade at $3.788 billion (real 2007$), was up 1.0 per cent ($38 million) from 2015 totals. Interprovincial goods exports are 11 per cent of all Nova Scotia external trade.
Interprovincial goods exports are the fourth and final component of Nova Scotia’s external trade at $3.086 billion (real 2007$), was up 2.4 per cent ($73 million) from 2015 totals. Interprovincial goods exports share of external trade is 9 per cent of all Nova Scotia external trade.
By commodity category: services ($10.9 billion real 2007$) dominate goods ($7.5 billion). Over 59% of total interprovincial trade value is in the import and export of services, and the remaining 41% is import/export of goods.
By market: imports ($11.6 billion = 63%) dominate exports ($6.9 billion = 37%). As a result, Nova Scotia interprovincial trade typically posts a deficit.
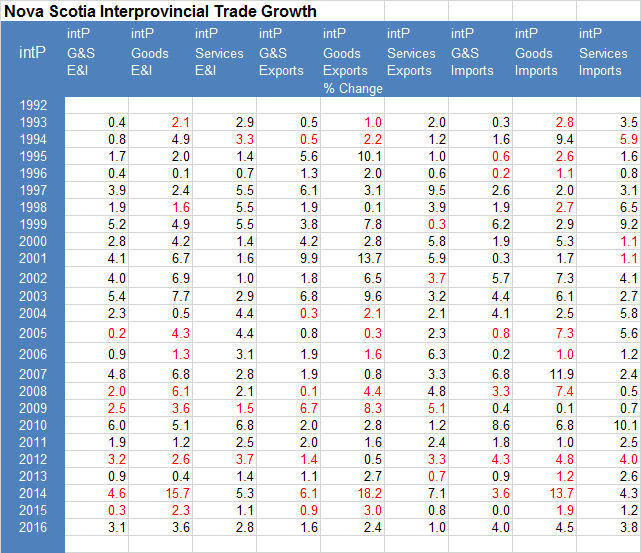
INTERPROVINCIAL TRADE REAL GROWTH
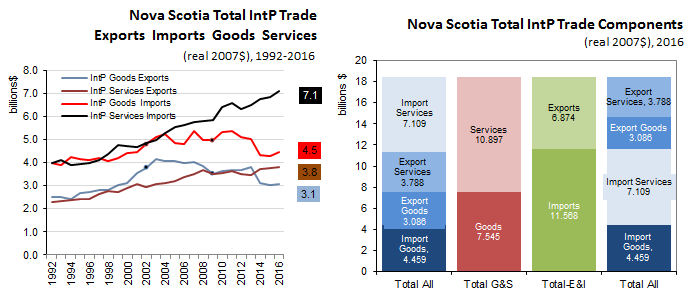
The long run real 2007$ trend for interprovincial service imports and interprovincial service exports are characterized by moderate year-over-year growth over the 1992-2016 period, with imports exhibiting the stronger growth.
The long run trend for interprovincial goods imports is characterized by strong year-over-year growth over the 1992-2002 period; stagnant growth 2004-2012; then declining growth 2013-2016.
The long run tend for interprovincial goods exports is strong year-over-year growth 1992-2002, then declining growth 2002-2016.
SEE ALSO:
Nova Scotia Interprovincial Trade 2016 (Nominal)
SOURCES:
Statistics Canada. Table 36-10-0222-01 Gross domestic product, expenditure-based, provincial and territorial, annual (x 1,000,000) (formerly CANSIM 384-0038)
<--- Return to Archive