The Economics and Statistics Division maintains archives of previous publications for accountability purposes, but makes no updates to keep these documents current with the latest data revisions from Statistics Canada. As a result, information in older documents may not be accurate. Please exercise caution when referring to older documents. For the latest information and historical data, please contact the individual listed to the right.
<--- Return to Archive
For additional information relating to this article, please contact:
October 09, 2018HOUSING STARTS, SEPTEMBER 2018 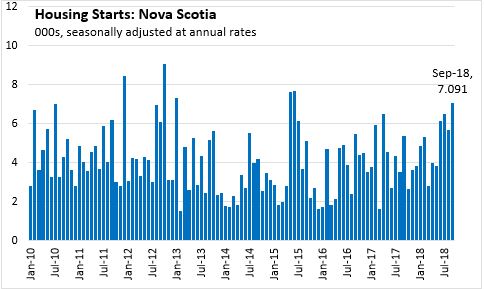
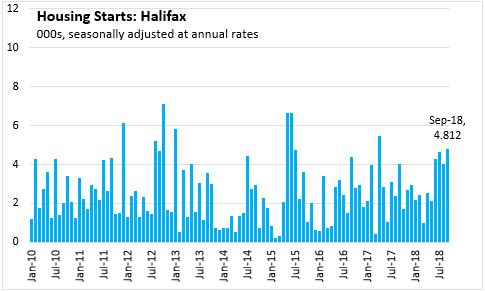
Nova Scotia's housing starts (seasonally adjusted annualized rate) increased 24.2 per cent in September to 7,091 compared to 5,708 in August. Housing starts were up 19.9 per cent in Halifax to 4,812 compared to 4,013 in August.
Compared to September 2017, Nova Scotia housing starts were up 31.5 per cent, and Halifax starts were up 19.9 per cent.
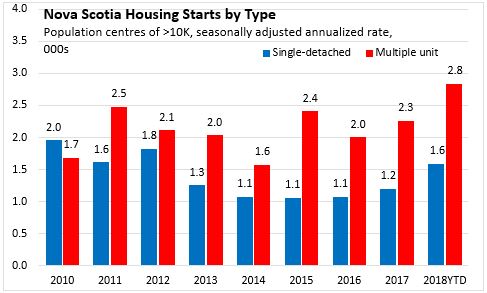
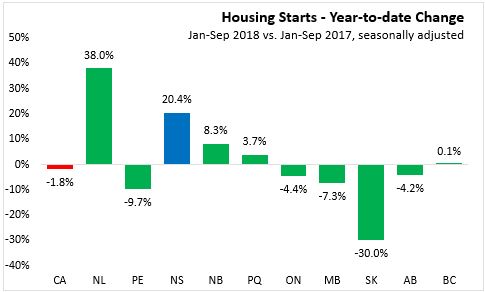
Year-to-date, housing starts are up 20.4 per cent compared to the same period in 2017. So far in 2018 starts have increased for both singles and multiples in urban areas.
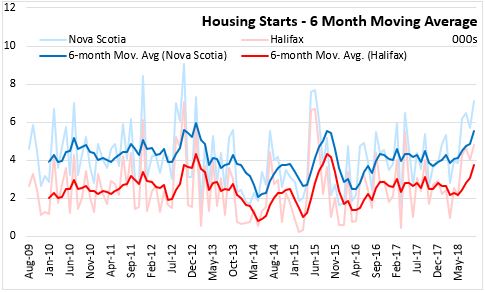
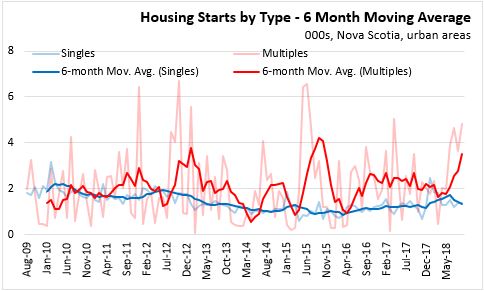
The six-month average of housing starts in both Halifax and Nova Scotia has risen through most of 2018 after being flat over 2017.
In urban areas, housing starts for multiples are generally higher than for singles with greater variability month-to-month. Starts for singles remained steady through 2017 and were elevated in the first half of 2018. Multiple starts have been stronger for the past four months compared to the start of 2018.
Nationally, housing starts are down 5.1 per cent in September to 188,683 compared to 198,843 in August. Compared to September 2017, housing starts were down 13.8 per cent.
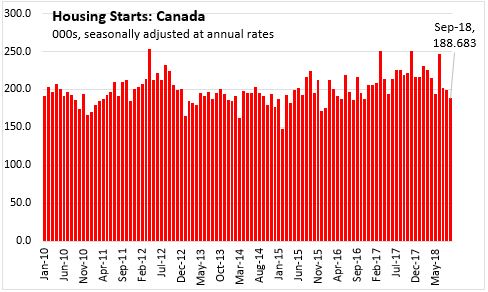
On a year-to-date basis, national housing starts were down 1.8 per cent compared to the first nine months of 2017. Housing starts were up in five provinces compared to January through September 2017. In percentage terms, Newfoundland and Labrador reported the largest increase (+38.0 per cent), while Saskatchewan posted the largest decline (-30.0 per cent).
Note: Urban areas are defined as areas over 10,000 people
Statistics Canada. Table 34-10-0158-01 and Table 34-10-0156-01
CHMC Housing Market Information Portal
<--- Return to Archive