The Economics and Statistics Division maintains archives of previous publications for accountability purposes, but makes no updates to keep these documents current with the latest data revisions from Statistics Canada. As a result, information in older documents may not be accurate. Please exercise caution when referring to older documents. For the latest information and historical data, please contact the individual listed to the right.
<--- Return to Archive
For additional information relating to this article, please contact:
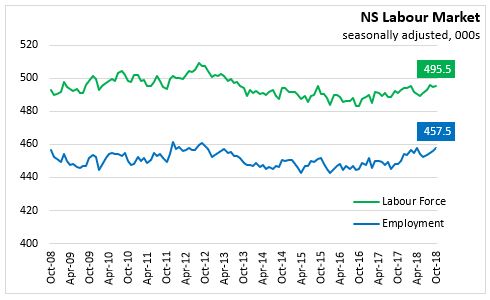
November 02, 2018LABOUR MARKET TRENDS - OCTOBER 2018 Nova Scotia's seasonally adjusted employment increased by 1,300 to 457,500 in October 2018. This is the first time that there were four consecutive months of employment growth since the beginning of 2013. The employment level has remained over 450,000 since December 2017.
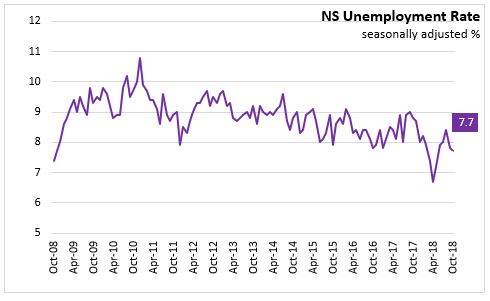
Compared to September, Nova Scotia’s labour force increased by 800 to 495,500 in October. With labour demand growing at a slightly faster pace than labour supply, the net result was a 0.1 percentage point decline in the seasonally adjusted unemployment rate to 7.7 per cent in October.
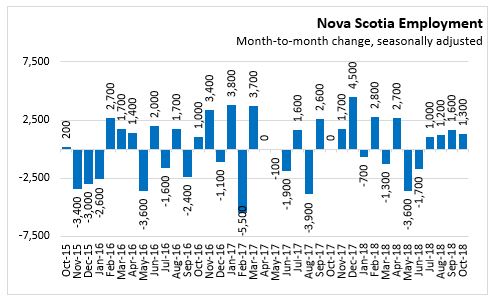
In October, the increase in employment was due to a gain in part-time employment (1,800) more than offsetting the drop in full time employment (-500). Full time employment is now below record level established in August. Changes in part-time and full-time employment can include the net impacts of changing hours of work within the same position.
Year-to Date (January-October 2018 vs. January-October 2017)
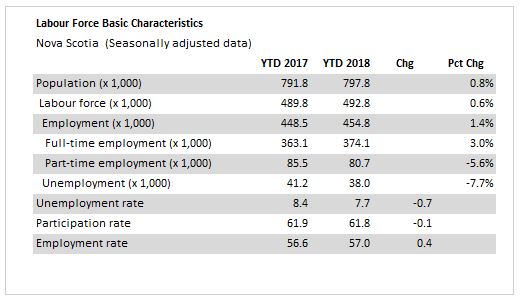
Comparing the first ten months of 2018 to the same period in 2017, there was an increase of 6,600 (1.5 per cent) in the average employment level. Full time employment was up 10,700 (2.9 per cent) while there were 4,100 fewer part-time jobs (-5.6 per cent).
The labour force was up 3,200 (0.6 per cent) compared to the first ten months of 2018. With labour demand increasing at a faster pace, the net result was a drop in the average unemployment rate of 0.8 percentage point to 7.7 per cent. The labour force participation rate decreased by 0.1 percentage points to 61.8 per cent. The employment rate increased from 56.6 per cent to 57.0 per cent.
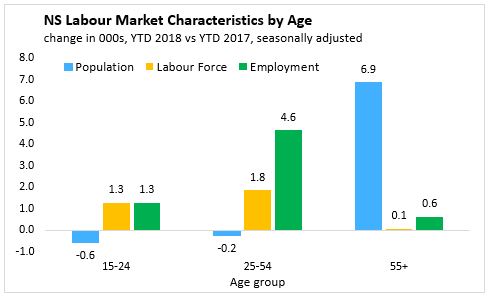
Age Cohorts
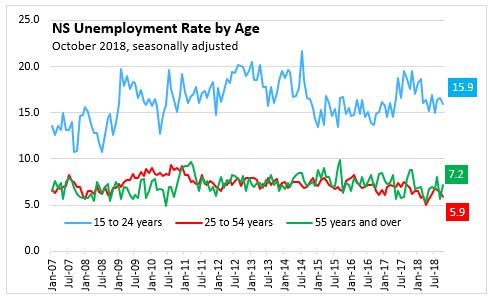
Comparing the first ten months of 2018 to the same period in 2017, the youth population (aged 15-24) saw a decrease in population (-600) and increases of 1,300 in both employment and labour force (1,300). With labour supply increasing at a slightly slower pace than employment, the unemployment rate for 15-24-year olds decreased from 16.9 per cent in the first ten months of 2017 to 16.5 per cent in the first ten months of 2018. For October, the youth unemployment rate was 15.9 per cent.
Within the 25-54 age cohort, the population declined 200 over the first ten months of the year. Employment increased 4,600 while labour force rose by 1,800. With employment increasing faster than the labour supply, there was a 0.9 per cent decline in the unemployment rate for this cohort, dropping to 6.1 per cent for the first ten months of 2018. The October unemployment rate for these core aged workers was 5.9 per cent.
The cohort aged 55 and older saw a population increase of 6,900 over the first three ten months of last year as well as a labour force increases of 100 and an employment gain of 600. With labour demand growing slightly faster than the labour supply, there was a decrease in the unemployment rate to 6.6 per cent (compared to 7.1 per cent over the first ten months of 2017). The October unemployment rate for the age group 55 and older was 7.2 per cent.
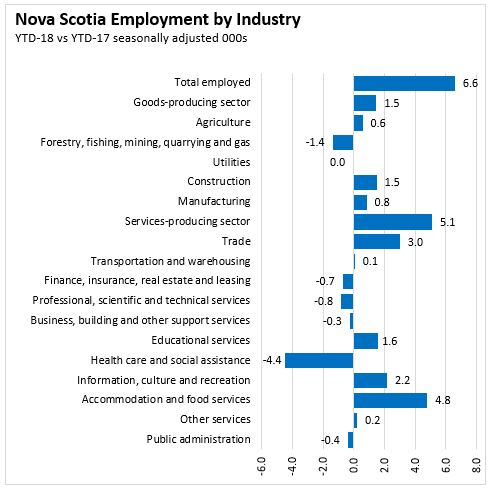
Sectors
Looking at public and private sector employees for the first ten months of 2018, the employment increase in private sector employees (6,600) was the driving force offsetting decreases in public sector employees (-2,000). For the same period self-employment was up 2,000.
Among goods-producing sectors, the first ten months of 2018 saw employment growth concentrated in manufacturing (+800) and construction (+1,500) offsetting declines in forestry, fishing, hunting, mining and oil and gas (-1,400). Services-producing employment increased by 5,100 for the first ten months of 2018 over the same period in 2017. The largest increases come from education, accommodation/food sectors, information, culture and recreation sectors and wholesale/retail trade. The largest decline came from health care and social assistance.
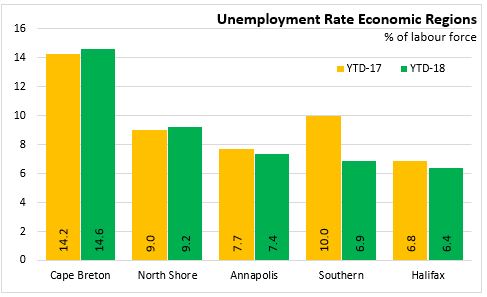
Regions (3 month moving average, January-October 2018 vs. January-October 2017)
Comparing the 3-month average for the first ten months of 2018 with the same period in 2017, Halifax and the South shore region were the only regions reporting a falling unemployment rate due to employment growth outpacing labour supply. The North Shore and Cape Breton regions had similar changes in both labour demand and labour supply with modest upward pressure on their unemployment rates. The Annapolis Valley reported a slightly faster decline in the labour supply along with a slight drop in employment putting downward pressure on their unemployment rate.
The Cape Breton region reported a decline of 500 for employment along with a decline of 300 in the labour force. This combination pushed the unemployment rate up 0.3 percentage points to 14.6 per cent.
For the North Shore region, employment and the labour force both declined by about 2,400. This combination pushed up the unemployment rate by 0.2 percentage points to 9.2 per cent.
The Annapolis Valley reported a decline of 1,500 for employment along with a decline of 1,800 for the labour force. There was also a slight drop in the number of unemployed workers. The net result was drop in the average unemployment rate of 0.3 percentage points to 7.4 per cent.
The Southern region saw an increase of 2,300 in employment along with an increase of 700 in the labour force. With the labour force and employment increasing, the unemployment rate was down 3.1 percentage points to 6.9 per cent.
Halifax experienced an increase in employment of 8,500 along with an increase in the labour force of 7,700. With the labour demand growing faster than labour supply the unemployment rate dropped by 0.5 percentage point to 6.4 per cent in Halifax.
Provincial Comparisons
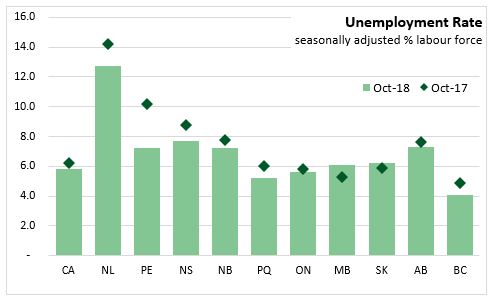
The Nova Scotia unemployment rate was 7.7 per cent in October 2018, down from 8.8 per cent a year ago. The Canadian unemployment rate was 5.8 per cent, down from 6.2 per cent one year ago. Compared to the same month one year ago, two provinces noted higher unemployment rates (Manitoba and Saskatchewan). All Atlantic provinces posted declines compared to October 2017. The lowest unemployment rate among the provinces this month was in British Columbia (4.1 per cent) while the highest was in Newfoundland and Labrador at 12.7 per cent.
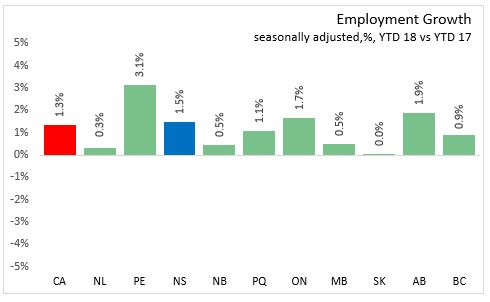
Comparing January-October 2018 with the same period in 2017, employment increased 1.3 per cent in Canada. Employment grew in all provinces. The largest gains were in in Prince Edward Island (+3.1 per cent). Employment was relatively flat in Saskatchewan (+0.05 per cent).
National Comparisons: Cities
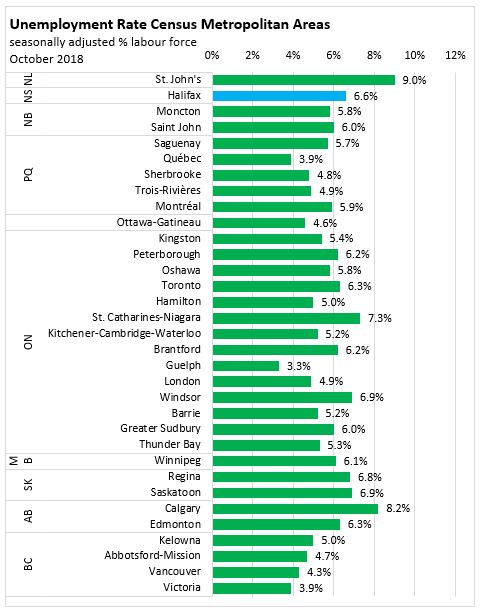
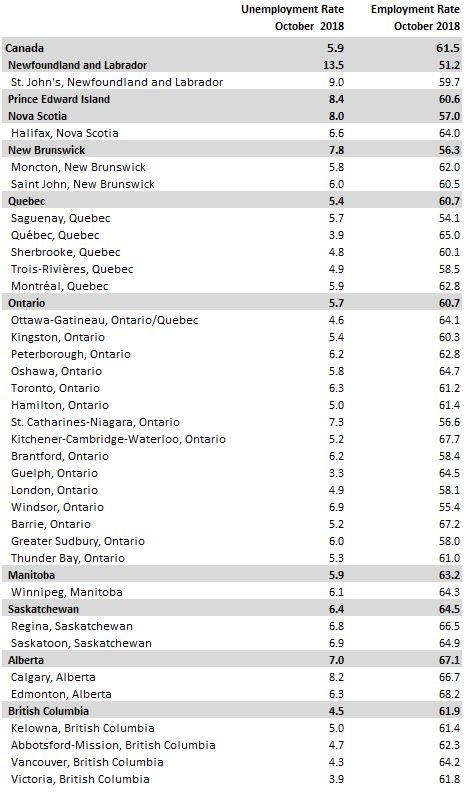
The seasonally adjusted unemployment rate for the Halifax Census Metropolitan Area (CMA) in August was 6.6 per cent. Guelph, Ontario (3.3 per cent) had the lowest unemployment rate among CMAs, while the highest was in St. John's (9.0 per cent).
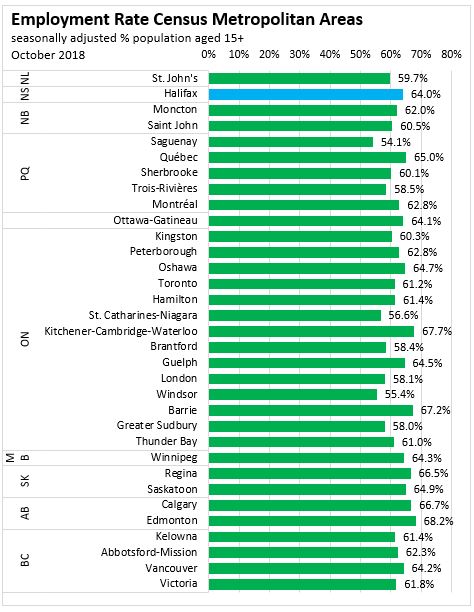
The seasonally adjusted employment rate for the Halifax CMA was 64.0 per cent, up slightly from last month. Saguenay had the lowest employment rate (54.1 per cent), while Edmonton had the highest (68.2 per cent).
The three month average employment ending in October for the Halifax CMA was up 0.3 per cent compared to the three month period ending in September. The largest gain among CMAs was in Peterborough, Ontario, where employment rose by 2.1 per cent.
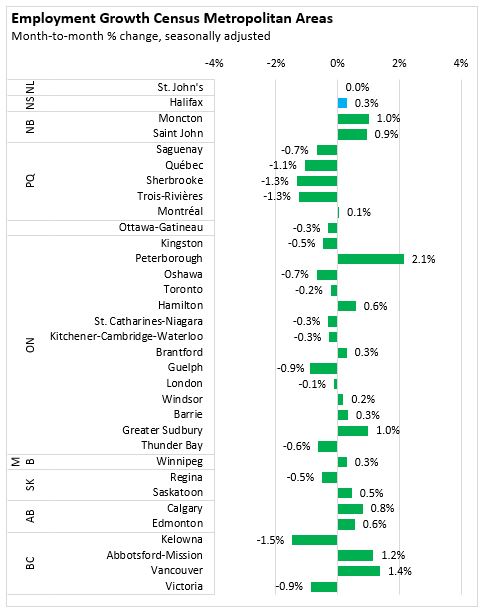
Note: Seasonally adjusted, 3 month average.
<--- Return to Archive