The Economics and Statistics Division maintains archives of previous publications for accountability purposes, but makes no updates to keep these documents current with the latest data revisions from Statistics Canada. As a result, information in older documents may not be accurate. Please exercise caution when referring to older documents. For the latest information and historical data, please contact the individual listed to the right.
<--- Return to Archive
For additional information relating to this article, please contact:
November 05, 2018LONG-RUN PROVINCIAL AND TERRITORIAL ECONOMIC DATA, 1926 TO 2016 Last week, Statistics Canada released a series of long-run economic data for provinces and territories. This includes population estimates, unemployment rates, and real income per capita. In general, data go back as far as 1950, while some reach back as far as 1926. Data are presented here by decade.
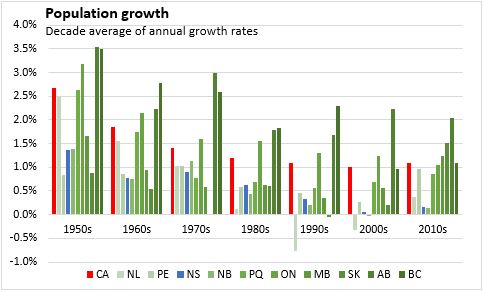
In general, population growth across the country has trended down since the 1950s. Since the 1950s, population growth has been the strongest in Alberta and British Columbia, followed by Ontario. Only since 2010 has population growth in the other prairie provinces (Saskatchewan and Manitoba) picked up above the Canadian average. The Atlantic provinces have typically had population growth below the national average.

Unemployment rates in Canada were highest through the 1980s and 90s. Over time, the gap between provinces remains relatively consistent. The Atlantic provinces have typically had the highest unemployment rates, while the prairie provinces have reported the lowest. Since 1950, Newfoundland and Labrador has recorded the highest average unemployment rates during each decade.

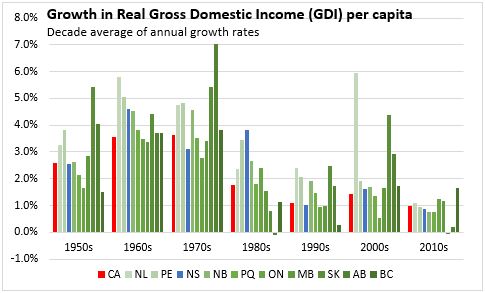
Average annual growth in real gross domestic income (GDI) per capita was highest in Canada in the 1960s and 1970s and lowest during the period 1990 to present. Per capita GDI growth in the Atlantic provinces has typically been above the Canadian average.
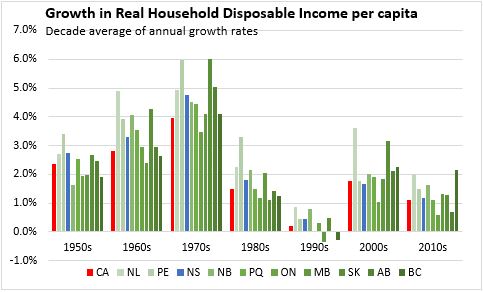
As with GDI, Canadian real household disposable income per capita grew the fastest in the 1960s and 70s. There was a significant slowing of per capita disposable income growth during the 1990s. During the 90s only the Atlantic provinces, Ontario and Saskatchewan showed, on average, positive annual growth during the period.
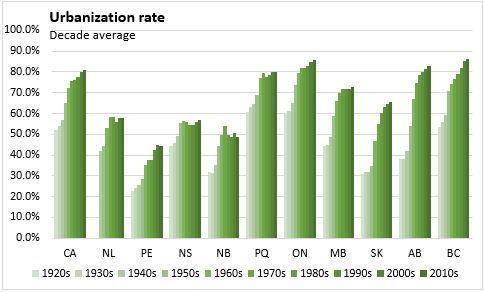
The urbanization rate represents the share of the total population who are living in urban areas. The average urbanization rate in Canada has trended upward since the 1920s. This is true for all provinces except Nova Scotia, New Brunswick and Newfoundland and Labrador. Nova Scotia’s urbanization rate has remained relatively flat between the 1950s when it averaged 55.5 per cent and the 2010s when it averaged 56.8 per cent. Urbanization rates in New Brunswick and Newfoundland and Labrador have remained relatively steady since the 1960s.
Source: Statistics Canada Table 36-10-0229-01
<--- Return to Archive