The Economics and Statistics Division maintains archives of previous publications for accountability purposes, but makes no updates to keep these documents current with the latest data revisions from Statistics Canada. As a result, information in older documents may not be accurate. Please exercise caution when referring to older documents. For the latest information and historical data, please contact the individual listed to the right.
<--- Return to Archive
For additional information relating to this article, please contact:
November 08, 2018PROVINCIAL GDP BY INDUSTRY 2017 [REVISED] GDP by industry estimates have been revised for 2015-2017 and updated to have a 2012 reference year. The following article has been updated to reflect the latest figures.
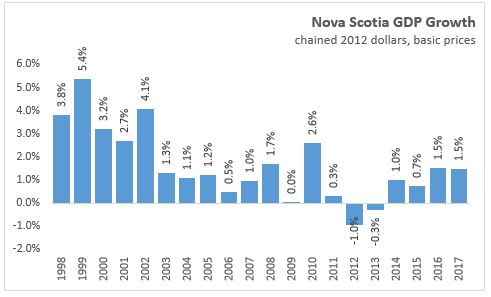
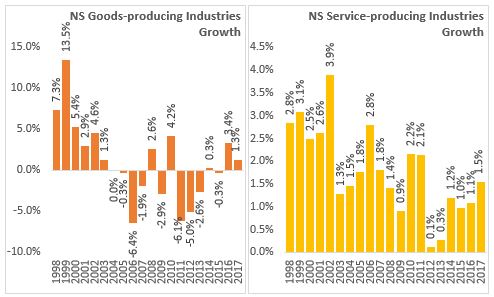
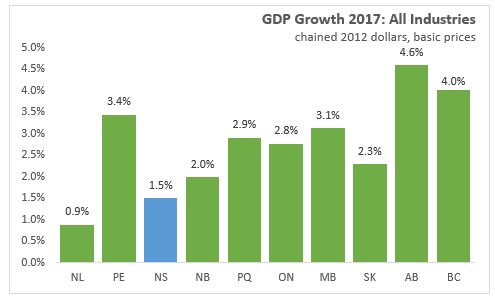
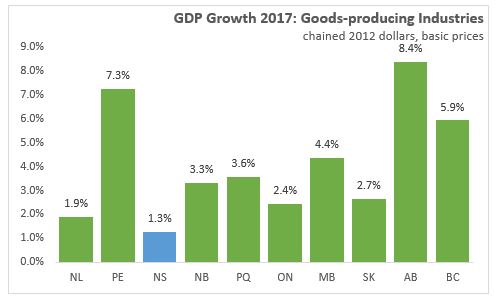
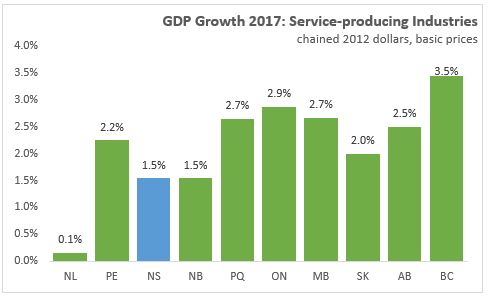
In 2017, Nova Scotia real GDP grew 1.5 per cent, the fourth consecutive year of growth. The goods-producing sector expanded by 1.3 per cent and service-producing industries grew by 1.5 per cent
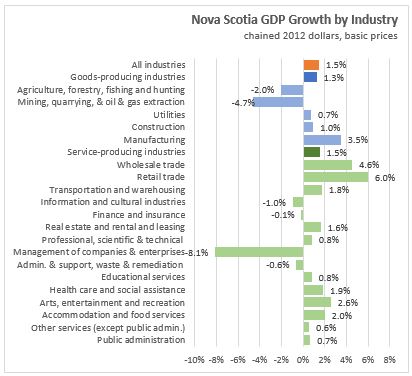
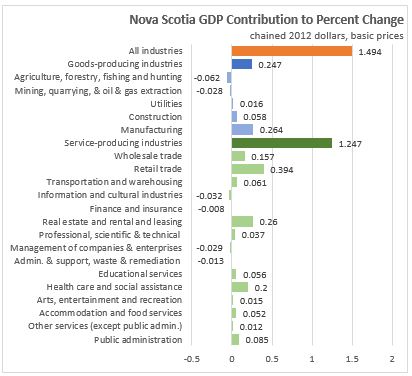
The goods-producing sector grew 1.3 per cent and contributed 0.247 percentage point to overall growth in 2017. Real GDP in oil and gas extraction sector declined 35.4 per cent. Mining and quarrying (except oil and gas) partially offset the decline with growth of 22.7 per cent as there was new production from gold mining and an increase in non-metallic mineral mining and quarrying from the introduction of new product line at the Cabot gypsum mine. The agriculture, forestry, fishing and hunting sector was down 2.0 per cent. Construction GDP increased 1.0 per cent with an increase in residential activity of 4.3 per cent, a decline in non-residential building construction with the completion of the Nova Centre, and electric power engineering construction rising 14.8 per cent. Manufacturing GDP grew for the third consecutive year, increasing 3.5 per cent with gains in plastics and rubber products, ships and boat building, paper manufacturing and chemical products offsetting declines in food products, fabricated metal products, and wood products.
Service-producing industries GDP grew by 1.5 per cent and contributed 1.247 percentage points to the overall growth rate in 2017. Wholesale trade rebounded from a decline in 2016 with growth of 4.6 per cent spread across most of its subsectors. Retail growth of 6.0 per cent was due to an increase in activity in all areas except gasoline stations and non-store retailers. Transportation and warehousing expanded 1.8 per cent with increased truck and air transportation but less activity with natural gas pipelines. Professional, scientific and technical services had a slower pace of growth than recent years. Offsetting the expansion in the business services sector were declines in information and culture (-1.0%), finance and insurance (-0.1%), administration and support, waste management and remediation services (-0.6%), and management of companies/enterprises (-8.1%). A new aggregate industry, public sector, is now published by Statistics Canada. The public sector increased 1.1 per cent in 2017 with increases in health, education and public administration GDP.
All provinces reported positive growth in both their goods-producing and service-producing sectors in 2017. The fastest goods-producing expansion occurred in Alberta (8.4%) and Prince Edward Island (7.3%). Service sector growth was fastest in British Columbia (+3.5%) and Ontario (+2.7%)
Source: Statistics Canada. Table 36-10-0402-01 Gross domestic product (GDP) at basic prices, by industry, provinces and territories (x 1,000,000)
<--- Return to Archive