The Economics and Statistics Division maintains archives of previous publications for accountability purposes, but makes no updates to keep these documents current with the latest data revisions from Statistics Canada. As a result, information in older documents may not be accurate. Please exercise caution when referring to older documents. For the latest information and historical data, please contact the individual listed to the right.
<--- Return to Archive
For additional information relating to this article, please contact:
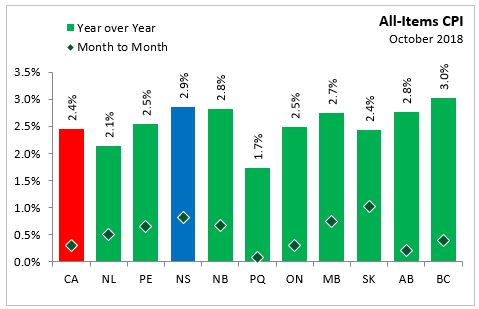
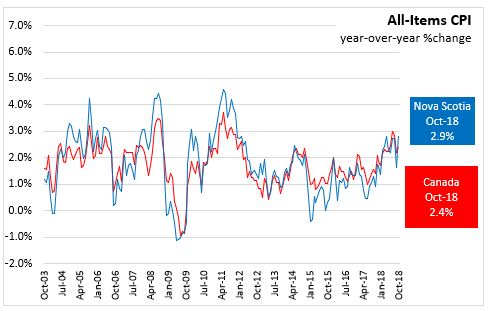
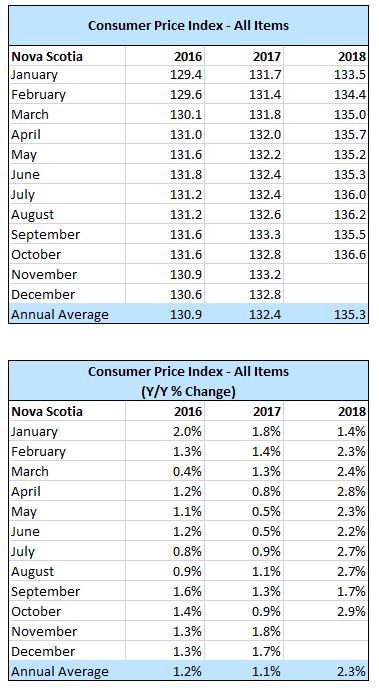
November 23, 2018ANALYSIS OF NOVA SCOTIA'S CONSUMER PRICE INDEX FOR OCTOBER 2018 In Nova Scotia October 2018, year over year growth for the All-Items Consumer Price Index was 2.9 per cent, below the national average of 2.4 per cent. Monthly consumer prices were up 0.8 per cent in Nova Scotia and up 0.3 per cent nationally.
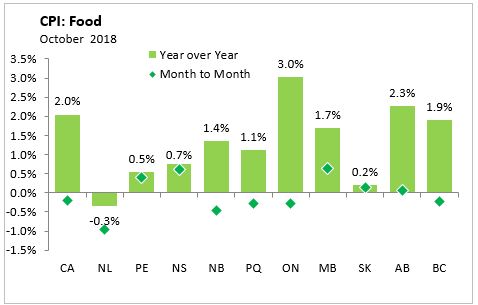
Within Atlantic Canada, Nova Scotia had the highest year over year consumer price inflation (+2.9%), followed by New Brunswick (2.8%) and PEI (2.5%), then Newfoundland and Labrador (+2.1%).
In October 2018, all provinces experienced positive year over year inflation, the highest in British Columbia (+3.0%).
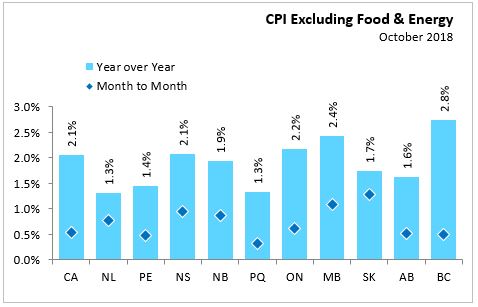
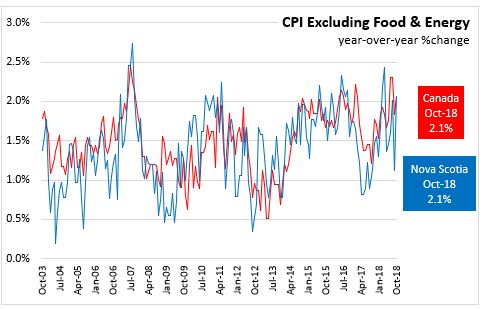
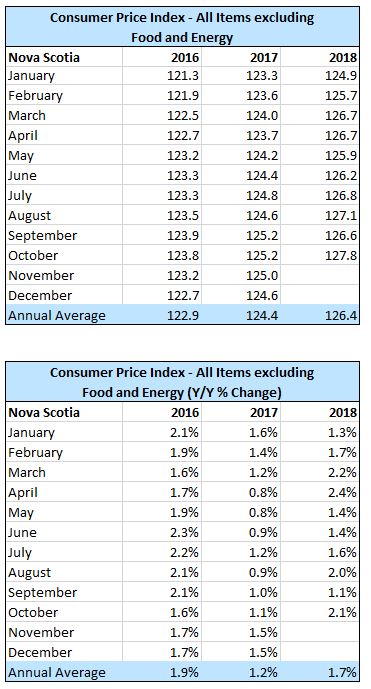
Nova Scotia's annual consumer price inflation (year over year growth in CPI) excluding food and energy rose 2.1 per cent in October , level with the national rate of 2.1 per cent. Price level gains for this index were largest in BC (+2.8 per cent), and lowest in Newfoundland and Labrador and Quebec (+1.3 per cent). On a monthly basis, Nova Scotia's index excluding food and energy was up 0.9 per cent.
The main contributors to the monthly (October 2018 vs. September 2018) NS CPI movement:
Passenger vehicle insurance premiums (+3.4%)
Telephone services (+3.3%)
Fresh fruit (-4.4%)
Traveller accommodation (-10.4%)
The main contributors to the annual (October 2018 vs. October 2017) NS CPI movement:
Fuel oil and other fuels (+23.5%)
Gasoline (+14.8%)
Home entertainment equipment, parts and services (-8.1%)
Traveller accommodation (-10.6%)
The CPI for food in Nova Scotia increased 0.7 per cent year-over-year with a 0.6 per cent increase month-to-month. CPI growth in food (year over year) was up in nine provinces, with only Newfoundland and Labrador reporting declines in October . Nationally, annual food prices increased 2.0 per cent.
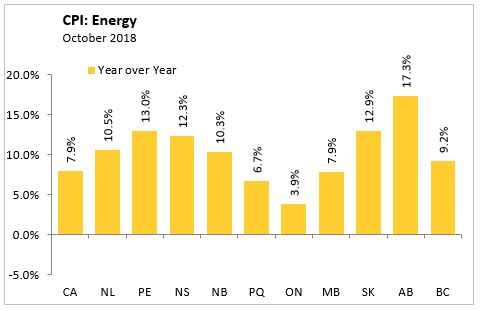
The Nova Scotia energy index increased by 12.3 per cent compared to a year ago. Energy price growth was smallest in Ontario (+3.9 per cent) on a year over year basis, and largest in Alberta (+17.3%). Nationally, the index was up 7.9 per cent.
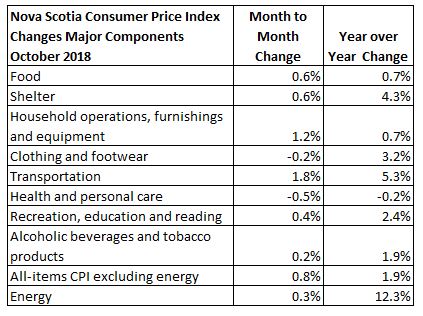
Major Components for October 2018
The following table shows the price increases specific to Nova Scotia for the major components of the CPI this month:
Long Run Trends
The All-Items CPI year over year inflation rate for Nova Scotia rose above Canada's in October 2018. Nova Scotia's annual inflation has remained below the Canadian average since mid-2014, with the exception of only a few months. While month to month movements in the indices can be different, over time they generally follow the same overall trend.
Annual inflation for the CPI excluding food and energy was the same for Nova Scotia (2.1 per cent) as for Canada in October .
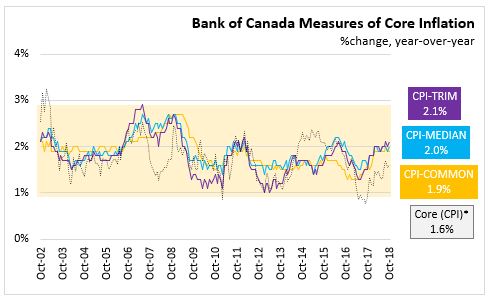
Bank of Canada's preferred measures of core inflation
Compared with October 2017, CPI-Trim rose 2.1 per cent, CPI-Median rose 2.0 per cent and CPI-Common rose 1.9 per cent in Canada. All-items CPI excluding eight of the most volatile components as defined by the Bank of Canada and excluding the effect of changes in indirect taxes (formerly referred to as CPIX) rose 1.6 per cent year over year in October 2018.
Appendix Tables and Charts
Source: Statistics Canada data portal: Tables 18-10-0004-01 and 18-10-0256-01
<--- Return to Archive