The Economics and Statistics Division maintains archives of previous publications for accountability purposes, but makes no updates to keep these documents current with the latest data revisions from Statistics Canada. As a result, information in older documents may not be accurate. Please exercise caution when referring to older documents. For the latest information and historical data, please contact the individual listed to the right.
<--- Return to Archive
For additional information relating to this article, please contact:
December 06, 2018NOVA SCOTIA - INTERNATIONAL MERCHANDISE TRADE OCTOBER 2018 Year-to-Date (Jan-Oct 2018 vs. Jan-Oct 2017, customs-based, unadjusted)
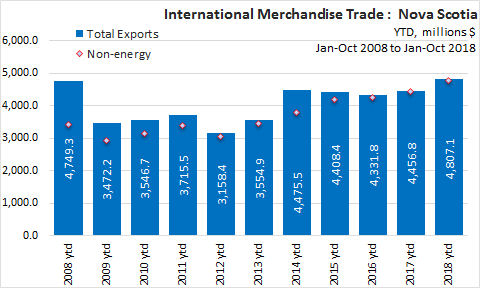
In Jan-Oct 2018, Nova Scotia International Merchandise Trade Exports increased 7.9% ($350 million) over Jan-Oct 2017, to $4.8 billion.
YTD - By Sector
Comparing Nova Scotia's exports for Jan-Oct 2018 with the same period last year the largest dollar value increase was in Forestry/Building/Packaging Materials ($142.5 million), Chemical, plastic, rubber ($40.8 million), and Motor vehicles/Parts ($38.7 million), Consumer Goods increased 1.5%.
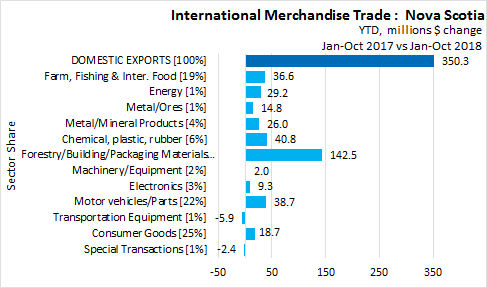

On a year-to-date basis, export values increased in
- Energy by 168.5% ($29.2 million)
- Metal/Ores by 36.4% ($14.8 million)
- Forestry/Building/Packaging Materials by 24.7% ($142.5 million)
- Chemical, plastic, rubber by 17.9% ($40.8 million)
- Metal/Mineral Products by 15.8% ($26.0 million)
- Electronics by 7.5% ($9.3 million)
- Farm, Fishing & Inter. Food by 4.2% ($36.6 million)
- Motor vehicles/Parts by 3.7% ($38.7 million)
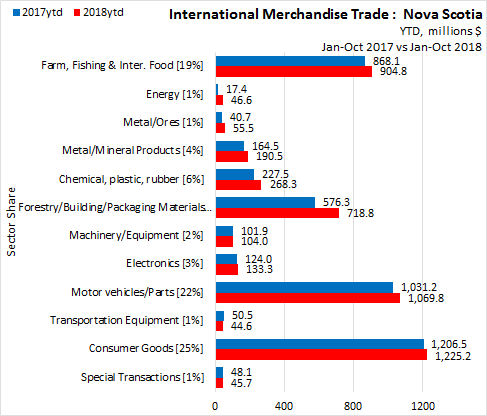
In Jan-Oct 2018, Consumer Goods led the way with a value of $1.2 billion (25 % share), followed by
- Motor vehicles/Parts with a value of $1.1 billion (22 % share),
- Farm, Fishing & Inter. Food with a value of $904.8 million (19 % share),
- Forestry/Building/Packaging Materials with a value of $718.8 million (15 % share),
- Chemical, plastic, rubber with a value of $268.3 million (6 % share),
- Metal/Mineral Products with a value of $190.5 million (4 % share),
- Electronics with a value of $133.3 million (3 % share),
- Machinery/Equipment with a value of $104.0 million (2 % share),
- Metal/Ores with a value of $55.5 million (1 % share),
- Energy with a value of $46.6 million (1 % share),
- Special Transactions with a value of $45.7 million (1 % share), and,
- Transportation Equipment with a value of $44.6 million (1 % share).
YTD by Province
In Jan-Oct 2018, Newfoundland and Labrador reported the highest increase (+31.4%) in merchandise trade exports over Jan-Oct 2017. Nova Scotia reported a 7.9% gain in merchandise trade exports. The Canadian average was an 8.2% increase in merchandise trade exports over Jan-Oct 2017.
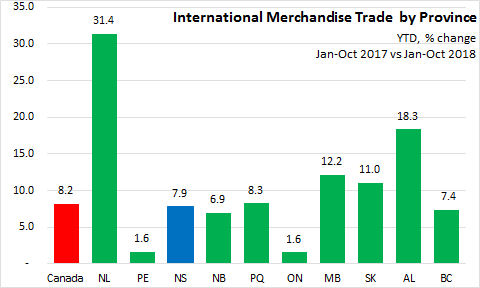
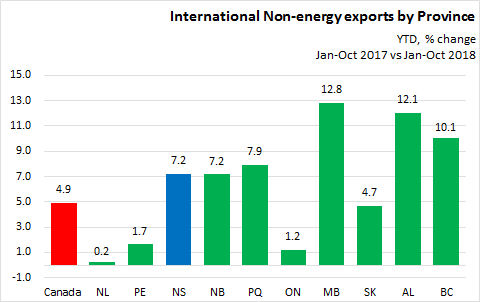
Excluding energy exports, Manitoba reported the fastest growth at 12.8%, followed by Alberta at 12.1% and British Columbia at 10.1%. Nova Scotia reported a 7.2% gain in non-energy merchandise trade exports. Canada reported a 4.9% increase in Non-energy exports.
Statistics Canada.
Table 12-10-0001-01 International merchandise trade by commodity (x 1,000,000)
12-10-0002-01 International merchandise trade by province and commodity (x 1,000,000)
12-10-0012-01 International merchandise trade by province, commodity, and Principal Trading Partners (x 1,000)
12-10-0099-01 Merchandise imports and exports, customs-based, by Harmonized commodity description and coding system (HS) section, Canada, provinces and territories, United States, states (x 1,000)
<--- Return to Archive