The Economics and Statistics Division maintains archives of previous publications for accountability purposes, but makes no updates to keep these documents current with the latest data revisions from Statistics Canada. As a result, information in older documents may not be accurate. Please exercise caution when referring to older documents. For the latest information and historical data, please contact the individual listed to the right.
<--- Return to Archive
For additional information relating to this article, please contact:
December 12, 2018SURVEY OF HOUSEHOLD SPENDING, 2017 Statistics Canada released the 2017 results of the Survey of Household Spending today. This survey tracks average household spending by a number of categories of current consumption and other expenditures. It provides a snapshot to compare how much Canadian households spend on a wide range of goods and services.
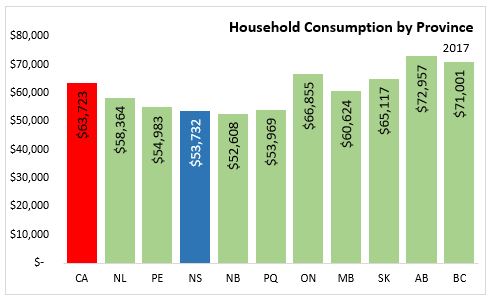
The average Nova Scotia household spent an average of $53,732 on goods and services in 2017, 1.1 percent lower than in 2016. This is below the national average of $63,723, and third highest in the region, behind Newfoundland and Labrador ($58,364) and PEI ($54,983). Alberta households had the highest average spending at $72,957. Across Canada, Nova Scotia, Saskatchewan, and Alberta all saw lower household consumption expenditures in 2017 compared to 2016.
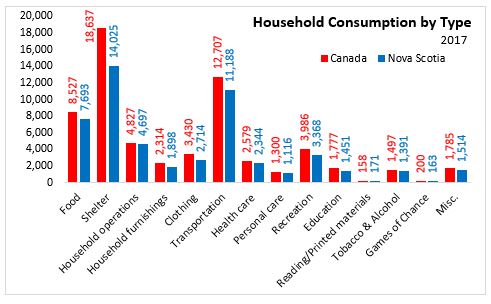
Looking closer at types of expenditure, in 2017 Nova Scotia households on average spent $7,693 on Food, $14,025 on Shelter, and $11,188 on transportation. The Canadian average household spending for food, shelter, and transportation were all higher. Nova Scotia households on average spent $4,697 on household operations, $1,898 on household furnishings, $2,714 on clothing and $3,368 on recreation. Compared to 2016, average household spending was down for food and shelter, but up in other large expenditure categories such as health care, education, and transportation. Food spending was down 5.2 per cent in 2017, shelter spending was down 0.1 per cent, and household operations expenditures decreased 6.9 per cent.

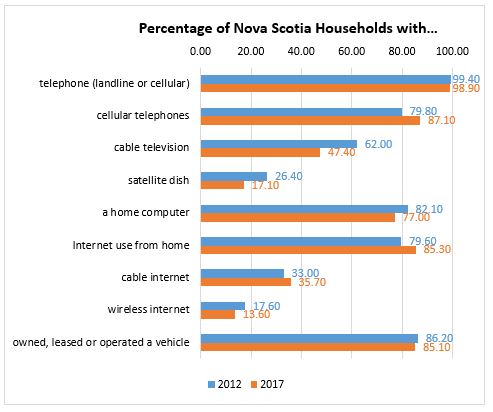
In addition to household consumption, total household spending also includes income taxes, personal insurance payments and pension contributions, and gifts of money, support payments, and charitable contributions. Income taxes constituted 18.0 percent of total household expenditures in 2017, higher than the national average (17.4%). The survey also describes characteristics such as household equipment, noting that cable and satellite television is on the decline compared to 2012, but cable internet and the occurrence of cellular devices (often multiple per household) are on the rise.
Source: Cansim Tables 11-10-0222-01 and 11-10-0228-01 and Statistics Canada, The Daily: Survey of Household Spending
<--- Return to Archive