The Economics and Statistics Division maintains archives of previous publications for accountability purposes, but makes no updates to keep these documents current with the latest data revisions from Statistics Canada. As a result, information in older documents may not be accurate. Please exercise caution when referring to older documents. For the latest information and historical data, please contact the individual listed to the right.
<--- Return to Archive
For additional information relating to this article, please contact:
December 14, 2018NATIONAL BALANCE SHEET ACCOUNTS, Q3 2018 
In the third quarter of 2018, Canadian national net worth increased 2.5 per cent (or $295.5 billion) to $12,063 billion, an acceleration from the 1.5 per cent growth in Q2 2018 due to an increase in the value of natural resources and an increase in net foreign assets. Canada's net foreign asset position increased by $116.1 billion to $647.9 billion in Q3 reflecting the strong performance of foreign stock markets.

Total assets, including financial and non-financial assets increased by 1.0 percent to $38.2 trillion at the end of the third quarter 2018.
Household sector
In the third quarter 2018, Canada’s household sector net worth at market value was up 0.4 per cent to $11.1 trillion. Non-financial assets were relatively flat with the value of residential real estate declining due to lower prices that was partially offset by an increase in the value of consumer durables and inventories. Financial assets rose with an increase in equity and investment funds.
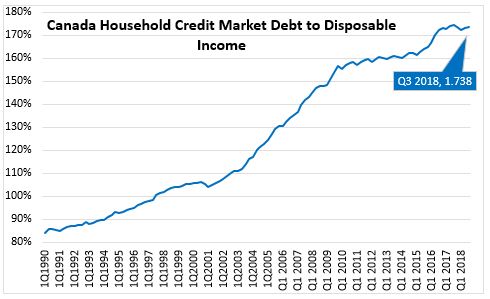
Household borrowing slowed for the third consecutive quarter in Q3 with $18.3 billion borrowed compared to $20.0 billion in the previous quarter. Mortgage loans were down in Q3 and were 43.2 per cent lower over the first three quarters of 2018 compared to the first three quarters of 2017. Credit market debt was $2.185 trillion in Q3 with mortgage debt of $1,424 billion, consumer credit at $648.6 billion and $112.7 billion in other loans.
Household credit market debt as a proportion of household disposable income increased to 173.8 per cent in the third quarter. Revisions that incorporate the latest T4 tax filings from 2016 lowered disposable income estimates and thus have lifted the ratio of credit market to disposable income since 2016.
Government sector
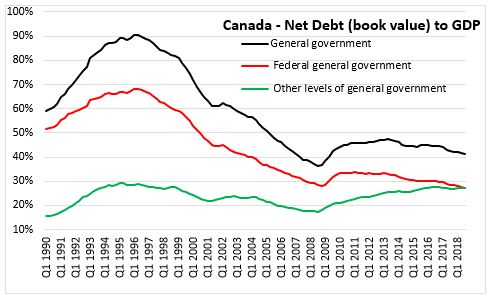
At the end of the third quarter 2018, general government net debt (book value) declined to 41.2 percent of GDP, compared to 41.5 per cent in the previous quarter. The federal government's net debt to GDP ratio decreased from 28.61 to 28.31 per cent, while other levels of government saw a decrease in net debt to GDP to 27.13 per cent from 27.20 per cent in the previous quarter.
Corporate sector
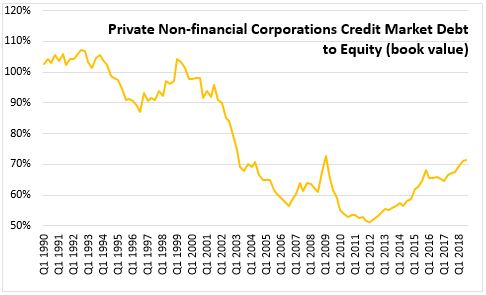
The credit market debt to equity ratio of non-financial private corporations was 71.50 cents of credit market debt for every dollar of equity in the third quarter 2018, up from 71.14 cents in the previous quarter. Demand for funds by non-financial private corporations was $29.3 billion in the third quarter - down from the previous quarter. For the first time since Q1 2016, non-financial private corporations recorded a net retirement on bonds and debentures.
Statistics Canada has released a set of provisional estimates of lending and borrowing by select non-bank financial intermediaries. Non-bank financial intermediaries account for a small share of total lending, but their overall growth from 2007 to 2017 has outpaced that of the traditional lending sectors.
An economic account for non-bank financial intermediation as an extension of the National Balance Sheet Accounts
Statistics Canada. Table 36-10-0607-01 Non-bank financial intermediation economic account (x 1,000,000)
Statistics Canada: National Balance Sheet and financial flow accounts
<--- Return to Archive