The Economics and Statistics Division maintains archives of previous publications for accountability purposes, but makes no updates to keep these documents current with the latest data revisions from Statistics Canada. As a result, information in older documents may not be accurate. Please exercise caution when referring to older documents. For the latest information and historical data, please contact the individual listed to the right.
<--- Return to Archive
For additional information relating to this article, please contact:
January 02, 2019NOVA SCOTIA TOTAL TRADE 2017 Total trade is a measure of external trade activity. It is calculated as the sum of exports plus imports for both goods and services and for international and interprovincial trading partners. The total openness index is an indicator of trade expansion or contraction relative to growth in GDP. These figures are calculated at current market prices, so commodity price fluctuations (particularly for volatile globally-traded goods like energy and food) can influence the values from one year to the next.

Over the period 2009 to 2017, Nova Scotia total trade was characterized by:
- initial trade expansion from 2009 to 2011. As the global economy recovered from a synchronized recession, Nova Scotia's trade openness increased
- Nova Scotia's trade openness contracted from 2011 to 2014, as paper mills closed and natural gas output declined
- Since 2014 Nova Scotia's trade openness has increased slowly, reflecting a short increase in natural gas output followed by continued decline at the same time as other exports (notably seafood) expanded. Falling energy prices after 2014 reduced the value of imports to Nova Scotia.
In 2017,
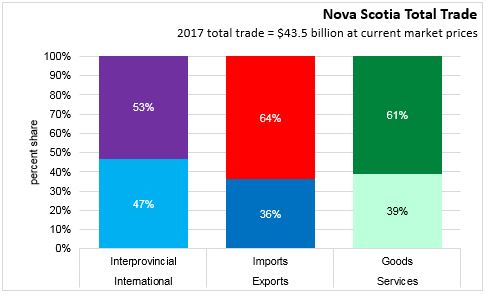
- Nova Scotia's interprovincial trade (exports+imports) accounted for 53 per cent of the province's total trade while international trade was 47 per cent.
- Of Nova Scotia's total trade (interprovincial+international), 36 per cent was exports while 64 per cent was imports.
- Nova Scotia's total trade (exports+imports, interprovincial+international) was comprised 61 per cent in goods and 39 per cent in services.
TOTAL TRADE GROWTH
In Nova Scotia 2016 vs 2017, ranking the components of Total trade and nominal GDP by year-over-year percentage growth yields the following:
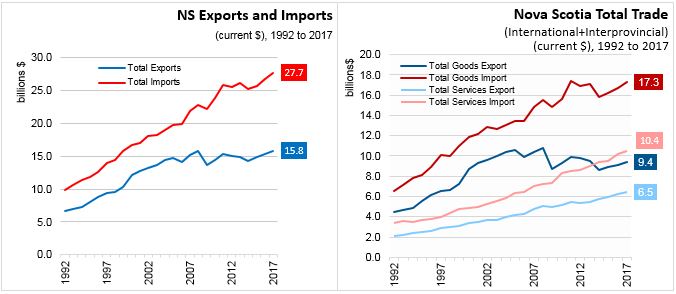
- TOTAL Imports of Goods increased 3.6% to $17.3 billion.
- TOTAL Exports of Services increased 3.2% to $6.5 billion.
- GDP increased 2.9% to $42.7 billion.
- TOTAL Imports of Services increased 2.8% to $10.4 billion.
- TOTAL Exports of Goods increased 2.8% to $9.4 billion.
TOTAL TRADE OPENNESS 2009-2017
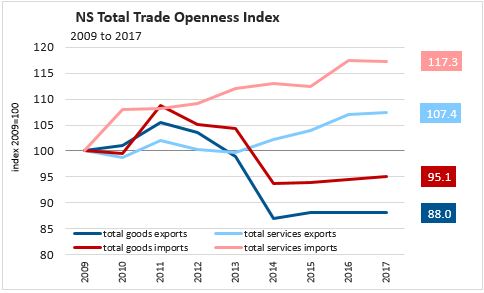
Trade openness should be compared to growth in provincial GDP. Nova Scotia's total trade openness shows that
- TOTAL Imports of Services decreased 0.1 points over 2016 to 117.3 and increased 17.3 points over 2009,
- TOTAL Exports of Services increased 0.3 points over 2016 to 107.4 and increased 7.4 points over 2009;
- TOTAL Imports of Goods increased 0.6 points over 2016 to 95.1 and decreased 4.9 points over 2009; and
- TOTAL Exports of Goods decreased 0.1 points over 2016 to 88.0 and decreased 12.0 points over 2009.
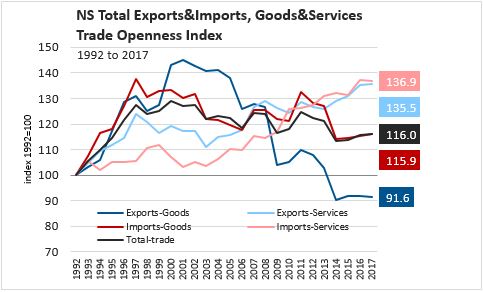
TOTAL TRADE OPENNESS 1992-2017
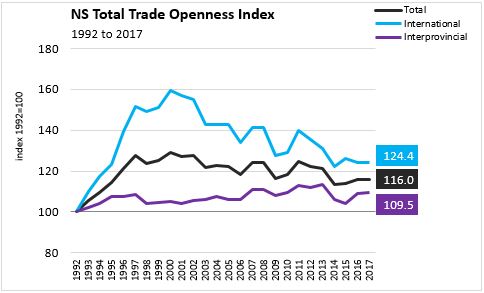
The total trade overview presented above provides insight Nova Scotia trade performance since the recession of 2009. The following overview provides a longer-range view to highlight trade over the last 25 years. This period (1992-2017) saw rapid global trade expansion, as China entered the international market, Nova Scotia exported a new, major commodity (natural gas). There was a global financial crisis, an economic recession and economic recovery.
In the period 1992 to 2000,
- Nova Scotia's total trade (international and interprovincial, imports and exports of goods and services) increased rapidly.
- TOTAL TRADE increased 75.1% from $16.5 billion to $28.9 billion.
- Nova Scotia's gross domestic product increased 35.8% from $18.8 billion to $25.5 billion.
In the period 2000 to 2017,
- Nova Scotia's total trade (imports and exports of goods and services) peaked as a share of GDP and subsequently declined.
- Much of the decline in trade openness is attributable to variations in natural gas production (affecting goods exports) and oil prices (affecting goods imports)
- TOTAL TRADE increased 50.9% from $28.9 billion to $43.5 billion.
- Nova Scotia's gross domestic product increased 67.6% from $25.5 billion to $42.7 billion.
- The Total trade to GDP ratio, or openness measure, contracted 12.9 points between 2000 (128.9) and 2017 (116.0).
Statistics Canada Table 36-10-0222-01
<--- Return to Archive