The Economics and Statistics Division maintains archives of previous publications for accountability purposes, but makes no updates to keep these documents current with the latest data revisions from Statistics Canada. As a result, information in older documents may not be accurate. Please exercise caution when referring to older documents. For the latest information and historical data, please contact the individual listed to the right.
<--- Return to Archive
For additional information relating to this article, please contact:
January 23, 2019PROVINCIAL AND TERRITORIAL GREENHOUSE GAS EMISSIONS, 2016 Statistics Canada has released preliminary data for greenhouse gas (GHG) emissions at the provincial and territorial level for the first time. These data reflect the activities of industries, households and governments. These estimates differ from those reported by Environment and Climate Change Canada under the National Inventory Report on Greenhouse Gas Sources and Sinks (NIR). The NIR fulfills Canada's reporting obligations under the United Nations Framework Convention on Climate Change and is the official benchmark for GHG emissions in Canada. Statistics Canada's GHG account is related to current economic activity and does not account for re-absorption of emissions later, while the NIR reflects net GHG emissions and includes other sources of GHGs. Additionally, Nova Scotia Environment requires companies in Nova Scotia covered by the Quantification, Reporting and Verification regulations to report GHG emissions directly to the province. These provincial and federal data sets may differ due to coverage, calculation methodology and data sources.
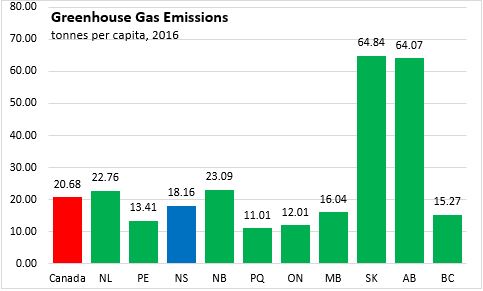
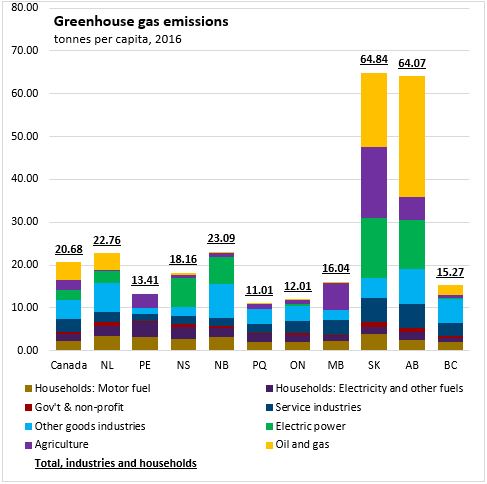
In 2016, Nova Scotian industries and households produced 18.16 tonnes of GHG emissions per capita. GHG emissions per capita were highest in Saskatchewan (64.84 tonnes per capita) and lowest in Quebec (11.01 tonnes per capita).
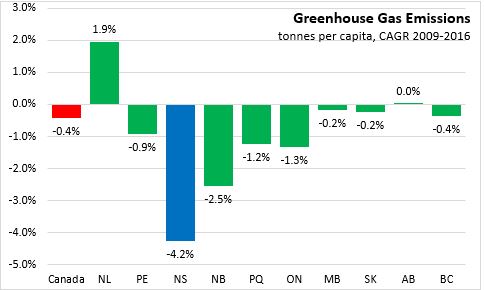
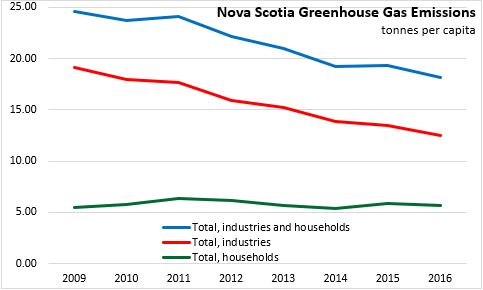
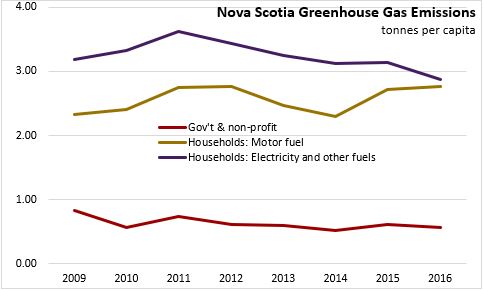
On a per capita basis, GHG emissions declined 4.2 per cent (compound annual growth rate, CAGR) in Nova Scotia from 2009 to 2016. This is largely due to declines in emissions from electric power generation and manufacturing industries. Household emissions have remained relatively constant since 2009, as declining emissions from electricity and other fuels was offset by higher emissions from motor fuels.
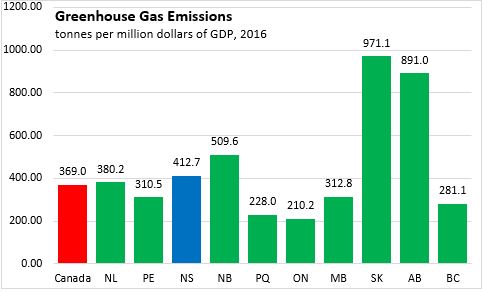
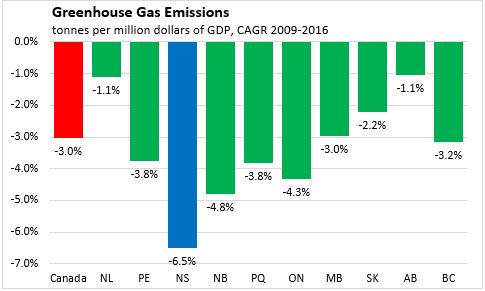
GHG emissions per million dollars of GDP were highest in Saskatchewan and Alberta and lowest in Ontario and Quebec in 2016. Nova Scotia industries and households emitted 412.7 tonnes per million dollars of GDP, higher than the Canadian average of 369.0. GHG emissions per million dollars of GDP declined in every province from 2009 to 2016, with Nova Scotia recording the largest decline (-6.5 per cent CAGR) and Alberta and Newfoundland and Labrador recording the smallest (-1.1 per cent CAGR).
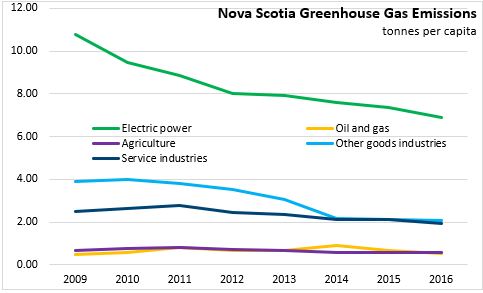
The source of GHG emissions varies across the country. In Nova Scotia, the largest share of GHGs comes from electric power generation. In Saskatchewan and Alberta, a much higher share comes from the oil and gas sector.
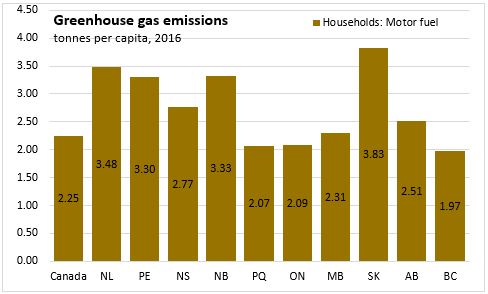
Differences in available fuels, climate, household size and household incomes are some of the factors that can influence household per capita emissions across the provinces. Household GHGs per capita from motor fuels (i.e. gasoline) were highest in Saskatchewan and lowest in British Columbia in 2016. British Columbia, Ontario and Quebec have a higher share of the population living in urban areas and less dependency on motor fuels. Household GHGs from electricity and other fuels were highest in the Atlantic provinces and lowest in Manitoba and British Columbia. In the Atlantic provinces, household natural gas is not widely available and other fuels are more common for heat and electricity compared to other provinces.

There were notable differences in GHG emissions from electric power generation across the provinces in 2016. The highest emissions per capita were in Saskatchewan and Alberta, followed by Nova Scotia and New Brunswick. Several provinces have hydroelectric or nuclear generation, emitting fewer GHGs than from conventional sources.

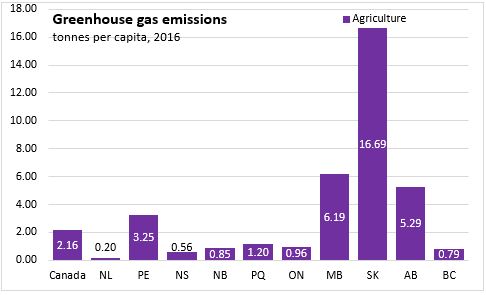
Emissions from agriculture were highest in Saskatchewan at 16.69 tonnes per capita. Nationally, GHG emissions from agriculture averaged 2.16 tonnes per capita.
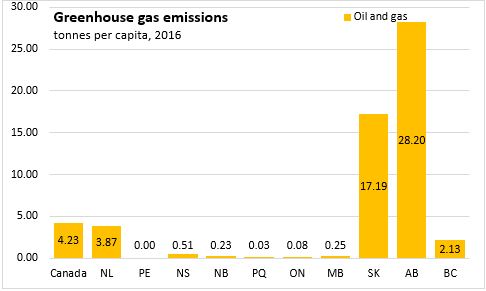
GHG emissions from the oil and gas sector were significantly higher in Saskatchewan and Alberta than in any other province.
Emissions from other goods industries were highest in Alberta and New Brunswick. This includes emissions from the forestry sector (pulp, paper and paperboard mills), oil refineries (petroleum and coal product manufacturing), and support activities for oil and gas extraction.

GHG emissions from the government and non-profit sector were highest in Saskatchewan and lowest in Prince Edward Island.

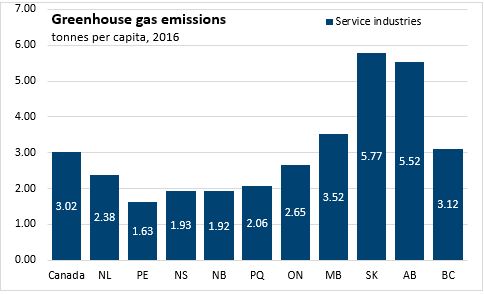
Emissions from service industries were highest in the prairie provinces and lower in the Atlantic provinces and Quebec.
Source: Statistics Canada Table 38-10-0097-01 | Daily Release
<--- Return to Archive