The Economics and Statistics Division maintains archives of previous publications for accountability purposes, but makes no updates to keep these documents current with the latest data revisions from Statistics Canada. As a result, information in older documents may not be accurate. Please exercise caution when referring to older documents. For the latest information and historical data, please contact the individual listed to the right.
<--- Return to Archive
For additional information relating to this article, please contact:
March 27, 2019ANNUAL HOUSEHOLD WEALTH, 2018 Statistics Canada has released the 2018 results for wealth of Canadian households. These results are consistent with the Canadian System of Macroeconomic Accounts, but provide greater details than are available through the National Balance Sheet Accounts.
Assets in 2018 amounted to $870,600 per household in 2018 (all figures reported in charts are $000s of dollars at current prices). Nova Scotia's average total asset values were lower at $591,277 per household. Average per household assets were highest in British Columbia, Ontario and Alberta. The lowest household assets were reported in Atlantic Canada.
Financial assets were slightly more than half of this value (52 per cent). Financial assets were more than half of asset values in all provinces except British Columbia. Saskatchewan reports the highest average value of financial assets while British Columbia reports the highest average value of non-financial assets (particularly for real estate). The lowest values of financial assets were observed in Newfoundland and Labrador while the lowest value of non-financial assets were reported in New Brunswick.

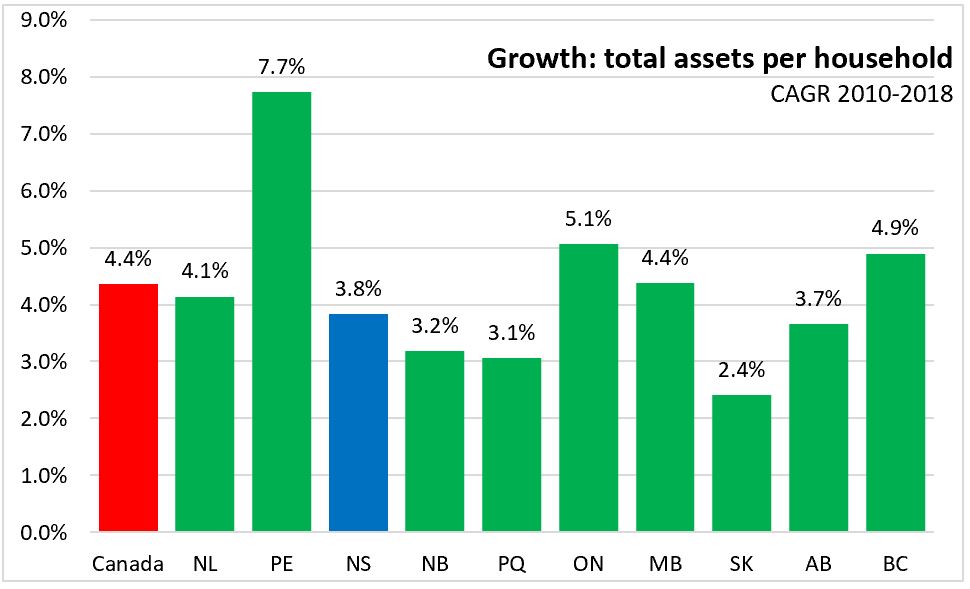
Household average asset values across Canada have growth at an annual pace of 4.4 per cent since 2010. The fastest growth in total assets over this time was reported in Prince Edward Island while the slowest growth was reported in Saskatchewan. Nova Scotia's average household assets increased at an annual rate of 3.8 per cent over this period.
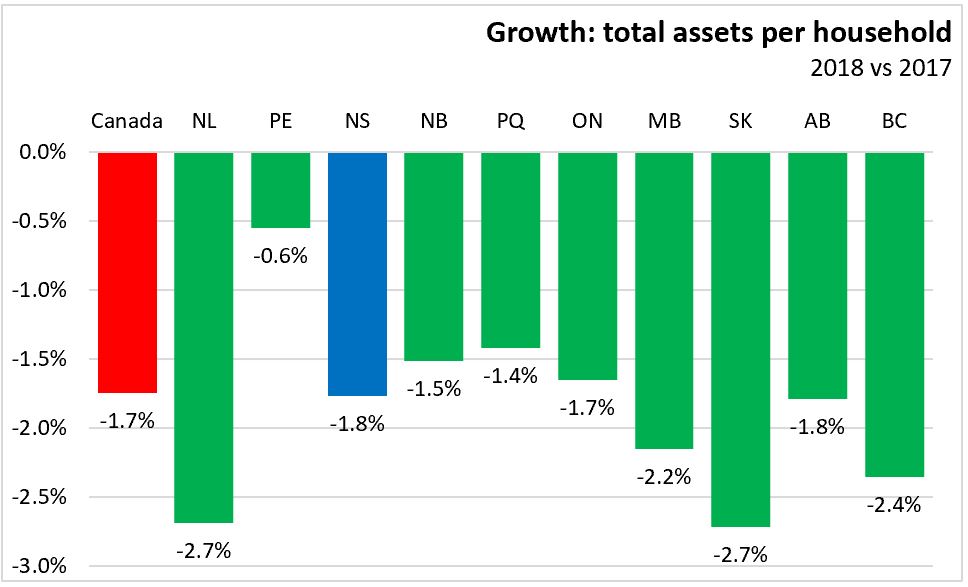
From 2017 to 2018, there has been a decline in average household asset values, falling by 1.7 per cent. The declines were sharpest in Newfoundland and Labrador, Saskatchewan and British Columbia. Average household asset values fell by 1.8 per cent in Nova Scotia during this period.
Financial assets are categorized into life insurance/pension assets and other financial assets. Life insurance/pension asset values are similar across many provinces, though there are slightly higher values in New Brunswick, Saskatchewan, Manitoba, Nova Scotia and Ontario. The average household amount of other financial assets varies more widely, with higher amounts in Alberta and Saskatchewan.

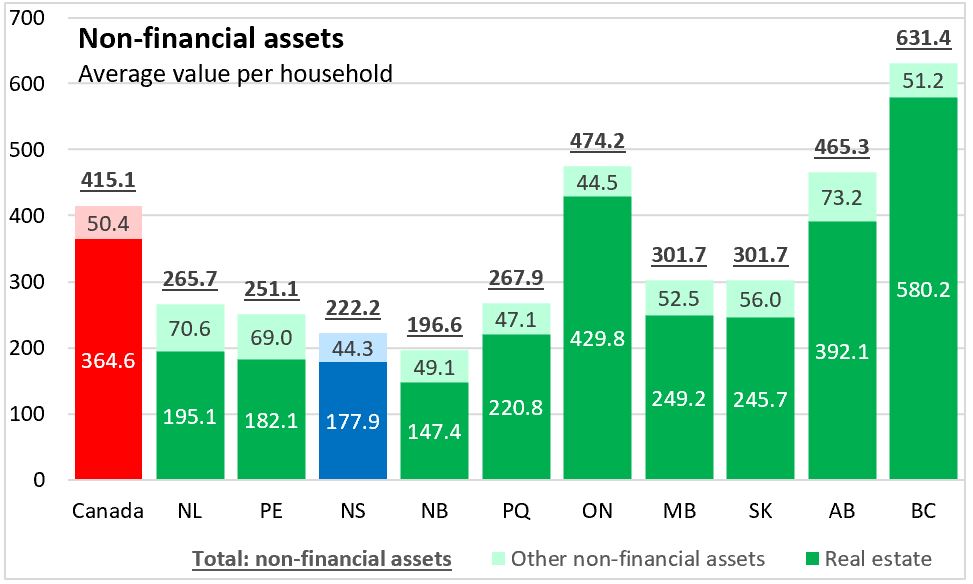
Real estate makes up the bulk of non-financial asset values in every province. The highest real estate asset values were reported in British Columbia, Ontario and Alberta. The lowest average real estate assets were reported in New Brunswick and Nova Scotia.
Statistics Canada' estimates that total financial liabilities average $150,403 per household. The lowest liabilities were reported in the Maritimes, particularly as morgage liabilities were lower (consistent with lower real estate asset values). The highest financial liabilities were observed in Alberta, British Columbia and Ontario.

Since 2010, total financial liabilities per household have grown by 3.5 per cent. There was faster growth in Manitoba, Ontario and Saskatchewan. Growth was slower in Prince Edward Island and Nova Scotia. Nova Scotia's mortgage liabilities fell over this period (the only province to report a decline), but this was offset by a faster rise in other financial liabilities. Prince Edward Island was the only province to report a decline in other financial liabilities, though this was offset by a small rise in mortgage liabilities.

From 2017 to 2018, total financial liabilities per household increased by 2.6 per cent nationally. Growth in liabilities was notably slower in Newfoundland and Labrador and faster for Prince Edward Island.

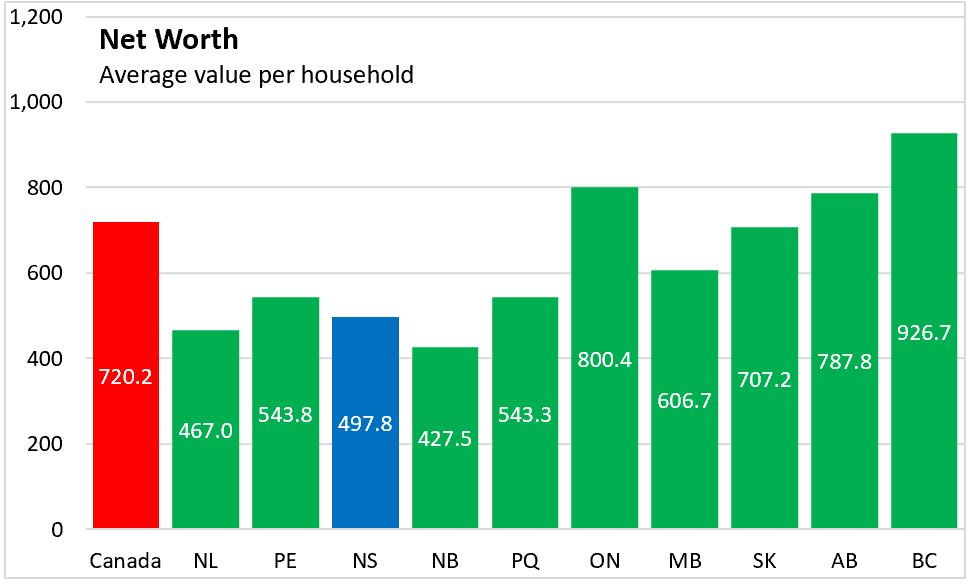
Net worth represents the difference in value between total assets and financial liabilities. National net worth amounted to $720,197 per household with the highest net worth in British Columbia, Ontario and Alberta. Net worth was lower in Quebec and all Atlantic Provinces. Nova Scotia's net worth averaged $497,796 per household in 2018.
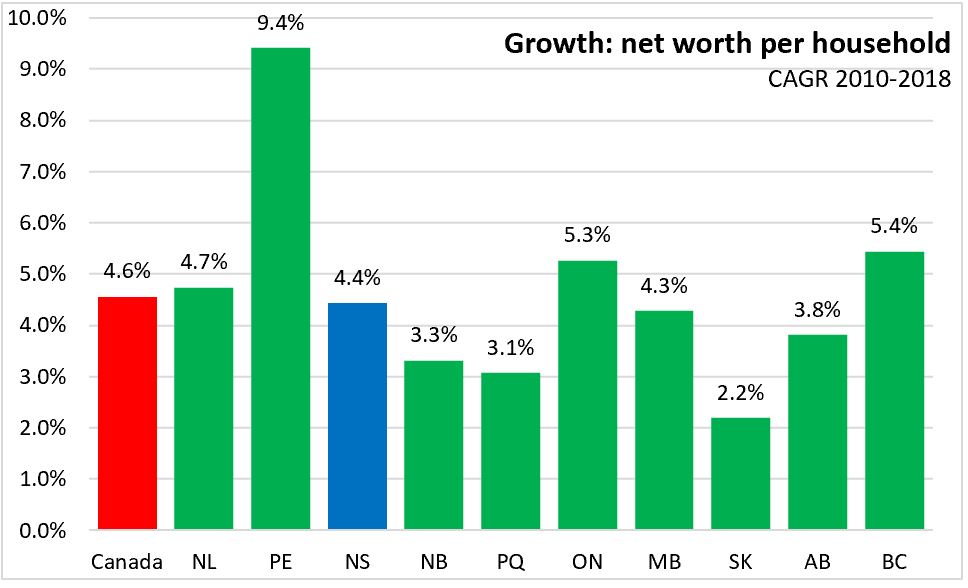
Over the period 2010-2018, household net worth grew by 4.6 per cent per year nationally (4.4 per cent per year per Nova Scotia household). There was faster growth in Prince Edward Island, British Columbia and Ontario and slower growth in Saskatchewan.
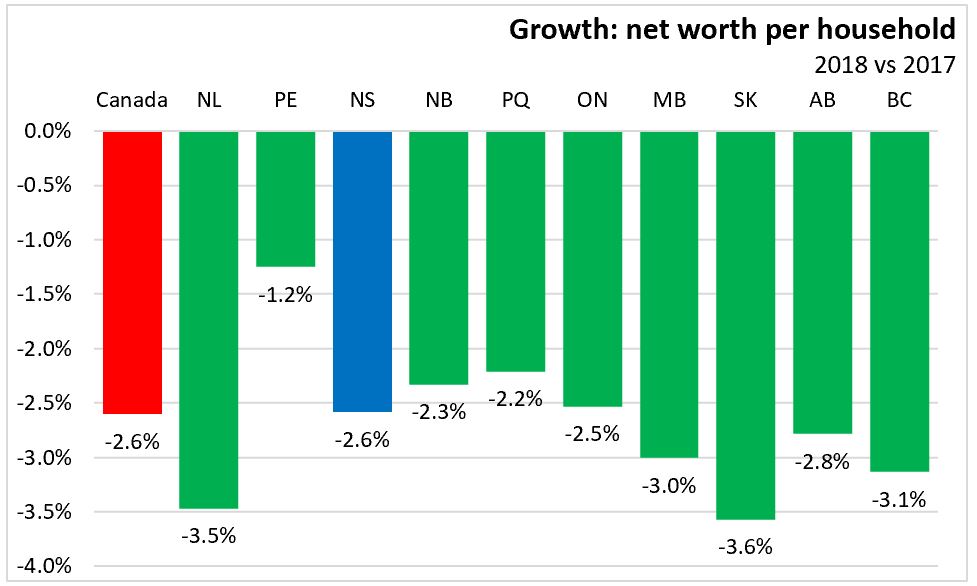
From 2017 to 2018, net worth per household declined as asset values fell and liabilities increased. National net worth declined by 2.6 per cent (the same pace was reported for Nova Scotia) and all provinces reported a decline. The declines were fastest in Saskatchewan and in Newfoundland and Labrador.
Overall national net worth amounted to 9.2 times the value of household disposable income. This ratio was highest for British Columbia and Ontario and lowest in New Brunswick and Newfoundland and Labrador.

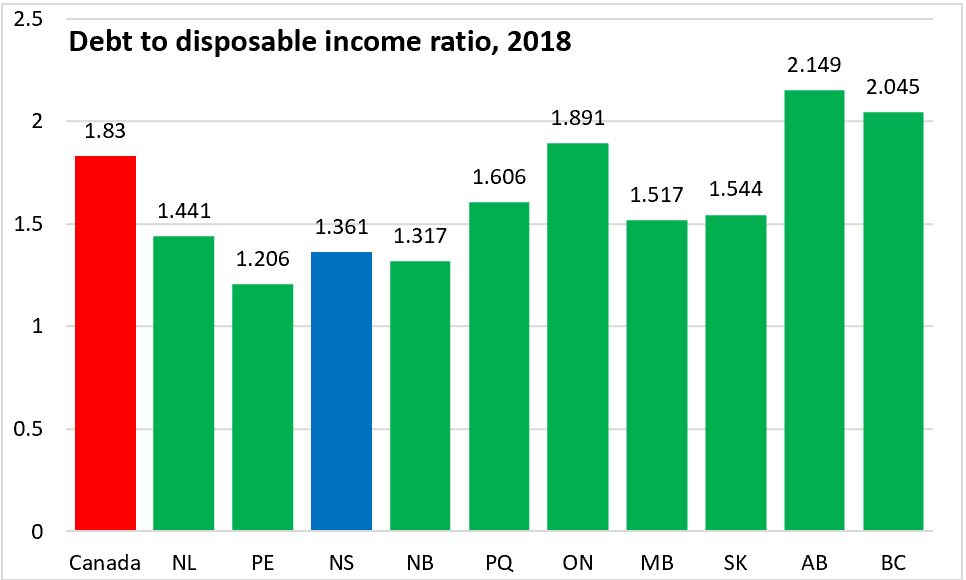
Debts amounted to 1.83 times disposable income in 2018. The highest debts (relative to disposable income) were reported in Alberta, British Columbia and Ontario while the lowest debt to income ratios were in the Maritimes.
Statistics Canada:
Table 36-10-0586-01 Distributions of household economic accounts, wealth, Canada, regions and provinces, annual (x 1,000,000),
Table 36-10-0590-01 Distributions of household economic accounts, wealth indicators, Canada, regions and provinces, annual
<--- Return to Archive