The Economics and Statistics Division maintains archives of previous publications for accountability purposes, but makes no updates to keep these documents current with the latest data revisions from Statistics Canada. As a result, information in older documents may not be accurate. Please exercise caution when referring to older documents. For the latest information and historical data, please contact the individual listed to the right.
<--- Return to Archive
For additional information relating to this article, please contact:
April 16, 2019MANUFACTURING SHIPMENTS, FEBRUARY 2019 NOVA SCOTIA
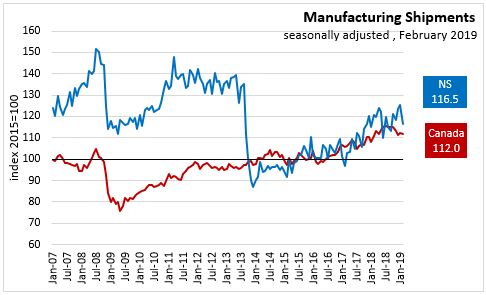
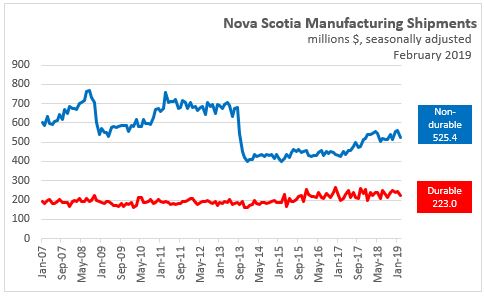
In Nova Scotia February 2019, seasonally adjusted manufacturing shipments decreased 7.0 per cent to $748.5 million over January 2019 and decreased 3.6 per cent over February 2018. Nova Scotia manufacturing shipments have been on an upward trend since 2014.
CANADA
In Canada January 2019, manufacturing shipments were down 0.2 per cent to $56.6 billion. Shipments decreased in 15 of 21 industries. Durable goods declined 1.4% to $30.1 billion, and non-durable goods increased 1.2% to $26.6 billion.
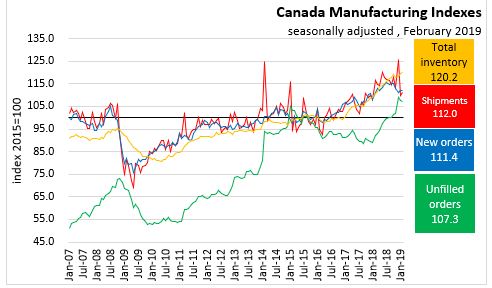
Inventory to sales ratio increased to 1.51 in February. Unfilled orders declined 0.4% to $101.9 billion. Unfilled orders were down in the aerospace product and parts (2.1%). Declines were partially offset by increases in ship and boat building and computer and electric products industries. New orders increased 1.5% to $56.3 billion over January 2019 because of higher orders of transportation equipment.
PROVINCES
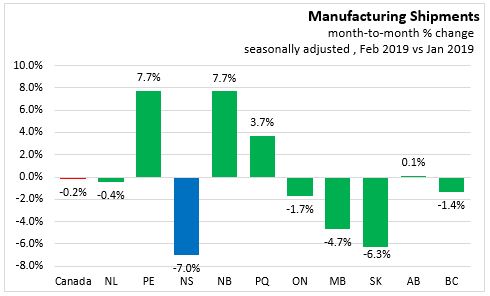
On a seasonally adjusted, month-over-month basis, Manufacturing sales increased in 4 provinces in February 2019 over January 2019. Prince Edward Island and New Brunswick had the largest growth at 7.7%. Nova Scotia shipment growth decreased 7.0%. In Canada shipments decreased 0.2%.
On a seasonally adjusted year-over-year basis, Manufacturing sales increased in 7 provinces in February 2019 over February 2018. Quebec had the largest growth at 5.4%. New Brunswick shipment growth decreased 14.4%. Nova Scotia shipments decreased 3.6%. In Canada shipments increased 0.9%.

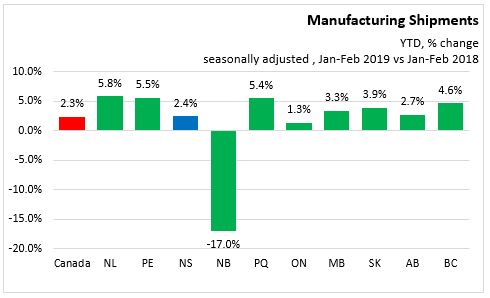
On a seasonally adjusted year-to-date basis, Manufacturing sales increased in 9 provinces in Jan-Feb 2019 over Jan-Feb 2018. Newfoundland and Labrador had the largest growth at 5.8%. New Brunswick shipment growth decreased 17.0%. Nova Scotia shipments increased 2.4%. In Canada shipments increased 2.3%.
NOVA SCOTIA SECTORS
Nova Scotia manufacturing shipments have been on an upward trend since the beginning of 2014 with rising durable (i.e. wood products, metal products, machinery, transportation equipment) and non-durable (i.e. food, paper/pulp, chemical, plastic and rubber) shipments. Seasonally adjusted non-durable shipments have risen from $408 million in January 2014 to $525 million in February 2019. Durable shipments have increased from $170 million in January 2014 to $223 million in February 2019.
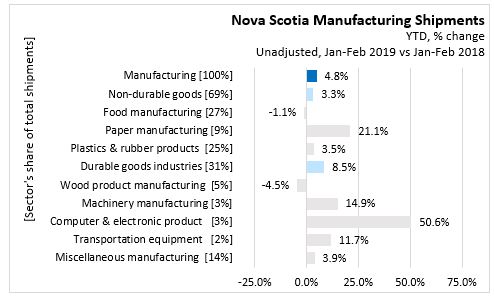
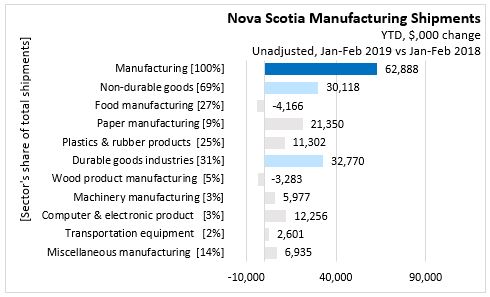
Unadjusted year-to-date (Jan-Feb 2019), Manufacturing Shipments increased 4.8% ($62.9 million) over the same period last year.
- Non-durable goods shipments, accounting for 69% of Manufacturing Shipments, increased 3.3% ($30.1 million),
- Food manufacturing with a 27% share decreased 1.1% ($4.2 million).
- Paper manufacturing, accounting for 9% of Manufacturing Shipments, increased 21.1% ($21.4 million).
- Plastics & rubber products with a 25% share increased 3.5% ($11.3 million).
- Durable goods industries with a 31% share increased 8.5% ($32.8 million).
- Wood product manufacturing with a 5% share decreased 4.5% ($3.3 million).
- Machine manuacturing with a 0.03% share decreased 29.5% ($0.2 million).
- Computer & electronics products with a 3% share inecreased 50.6% ($12.3 million).
- Transportation equipment with a 2% share increased 11.7% ($2.6 million).
- Miscellaneous manufacturing with a 14% share increased 3.9% ($6.9 million).
SOURCES
Statistics Canada Monthly survey of Manufacturing
Table 16-10-0047-01 Manufacturers' sales, inventories, orders and inventory to sales ratios, by industry (dollars unless otherwise noted)
Table 16-10-0048-01 Manufacturing sales by industry and province, monthly (dollars unless otherwise noted) (x 1,000)
<--- Return to Archive