The Economics and Statistics Division maintains archives of previous publications for accountability purposes, but makes no updates to keep these documents current with the latest data revisions from Statistics Canada. As a result, information in older documents may not be accurate. Please exercise caution when referring to older documents. For the latest information and historical data, please contact the individual listed to the right.
<--- Return to Archive
For additional information relating to this article, please contact:
May 03, 2019CANADIAN HOUSING STATISTICS PROGRAM Statistics Canada has released new data from the Canadian Housing Statistics Program on the total and above-grade living areas of residential properties in Nova Scotia, Ontario and British Columbia. The above-grade living area excludes finished basements and levels below ground and serves as a standardized measure to compare property sizes across geographies. Statistics Canada has also released data on assessment value per square foot to allow for more detailed comparisons of assessment values among property types and across geographies. Note that assessment value per square foot is based on the total living area, which includes finished basements.
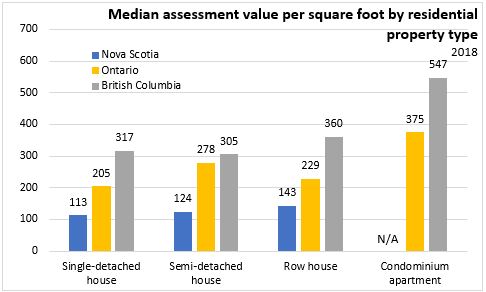
The median assessment value per square foot of residential property in Nova Scotia was $115 in 2018. This is lower than the median assessment value per square foot in Ontario ($222) and British Columbia ($371). In Halifax, the median assessment value per square foot was $142 and outside of Halifax was $96. Median assessment values per square foot were similar across property types in Nova Scotia, while they were higher for condominium apartments in both Ontario and British Columbia. Comparable data on condominium apartments is not available for Nova Scotia.
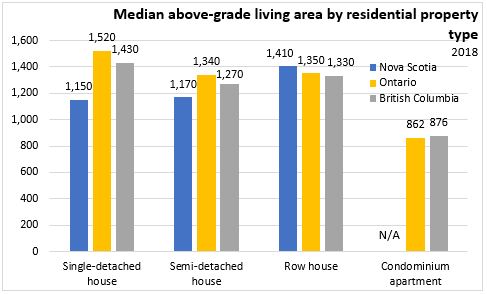
The median above-grade living area was 1,150 square feet in Nova Scotia. This was lower than in British Columbia (1,240 square feet) and Ontario (1,380 square feet). In Nova Scotia, the median above-grade living area was highest for row-houses (1,410 square feet) and lower among single-detached (1,150 square feet) and semi-detached (1,170 square feet) houses. In Ontario and British Columbia, single-detached houses were the largest among property types.
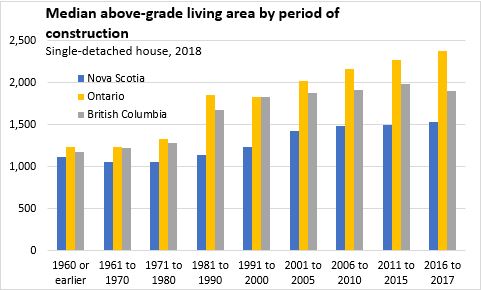
Newer homes (built between 2006 and 2017) tend to have the largest above-grade living area in all three provinces. Square-footage among single-detached houses has grown faster in Ontario and British Columbia than it has in Nova Scotia.
Source: Canadian Housing Statistics Program
<--- Return to Archive