The Economics and Statistics Division maintains archives of previous publications for accountability purposes, but makes no updates to keep these documents current with the latest data revisions from Statistics Canada. As a result, information in older documents may not be accurate. Please exercise caution when referring to older documents. For the latest information and historical data, please contact the individual listed to the right.
<--- Return to Archive
For additional information relating to this article, please contact:
July 17, 2019ANALYSIS OF NOVA SCOTIA'S CONSUMER PRICE INDEX FOR JUNE 2019 TRENDS - June 2019
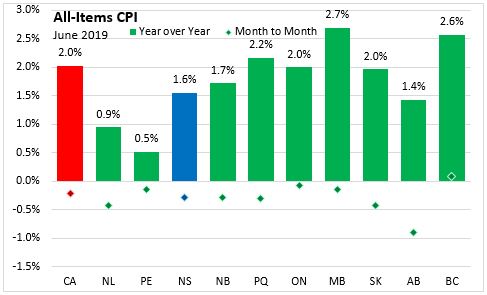
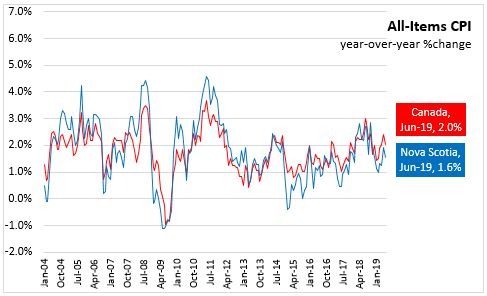
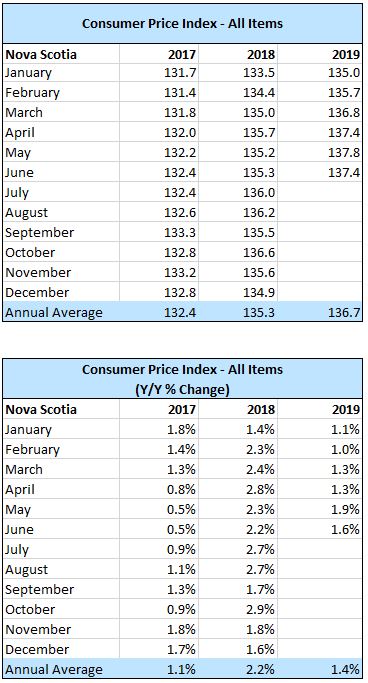
In Nova Scotia June 2019, year over year growth for the All-Items Consumer Price Index was 1.6 per cent, below the national average of 2.0 per cent. Monthly consumer prices were down 0.3 per cent in Nova Scotia and down 0.2 per cent nationally.
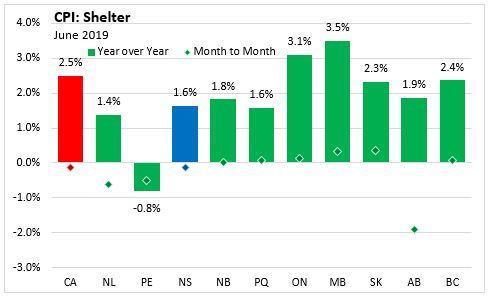
Within Atlantic Canada, New Brunswick had the highest year over year consumer price inflation (+1.7 per cent), followed by Nova Scotia (+1.6 per cent). Inflation was lower in Newfoundland and Labrador (+0.9 per cent) and Prince Edward island (+0.5 per cent).
In June 2019, the CPI decreased nationally largely due to lower month-over-month energy prices. The CPI increased 2.0 per cent on a year-over-year basis in June, down from a 2.4 per cent increase in May. Excluding energy, the CPI rose 2.6 per cent. Year over year inflation was lower than last month for nine provinces, with the highest inflation rate for June 2019 in Manitoba (+2.7 per cent).
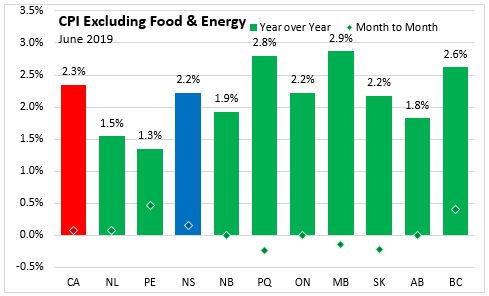
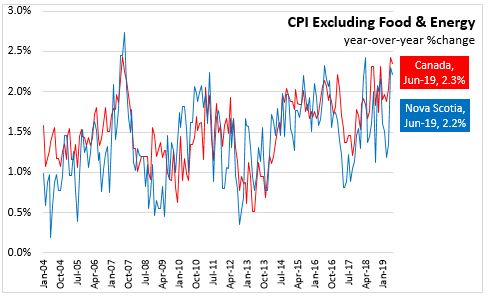
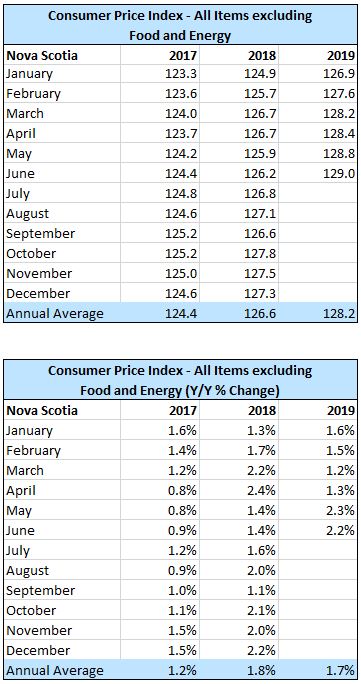
Nova Scotia's consumer price inflation (year over year growth in CPI) excluding food and energy rose 2.2 per cent in June, below the national rate of 2.3 per cent. Price level gains for this index were largest in Manitoba (+2.9 per cent), and lowest in Prince Edward Island (+1.3 per cent). On a monthly basis, Nova Scotia's index excluding food and energy was up 0.2 per cent.
The main contributors to the monthly (June 2019 vs. May 2019) NS CPI movement:
- Fresh vegetables (+16.0 per cent)
- Traveller accommodation (+12.0 per cent)
- Gasoline (-11.7 per cent)
- Women’s clothing (-6.6 per cent)
The main contributors to the annual (June 2019 vs. June 2018) NS CPI movement:
- Passenger vehicle insurance premium (+16.0 per cent)
- Purchase and leasing of passenger vehicles (+3.4 per cent)
- Gasoline (-11.5 per cent)
- Traveller accommodation (-11.3 per cent)
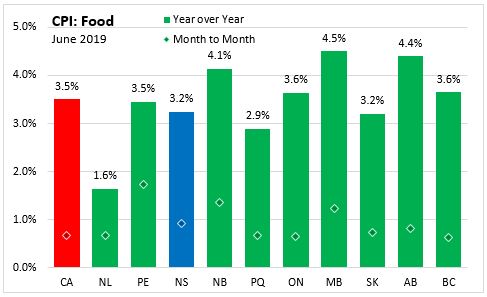
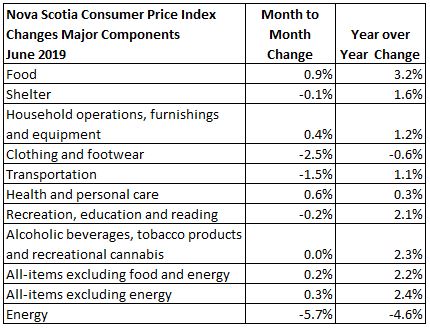
The CPI for food in Nova Scotia increased 3.2 per cent year-over-year with a 0.9 per cent increase month-to-month. CPI growth in food (year over year) was up in all provinces this month. Manitoba showed the highest year over year food price growth (+4.5 per cent). Nationally, annual food prices increased 3.5 per cent, due in part to inclement weather in source regions driving higher fresh vegetable prices (+17.3 per cent).
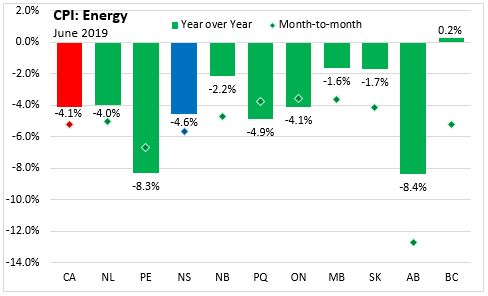
The Nova Scotia energy price index decreased by 4.6 per cent compared to a year ago. Monthly energy prices (June 2019 vs. May 2019) were down 5.7 per cent in Nova Scotia and 5.3 per cent lower nationally. Year-over-year energy price indexes were down the most in Alberta (-8.4 per cent), Prince Edward Island (8.3 per cent) and Quebec (4.9 per cent).
Year over year, the consumer price index for shelter increased by 1.6 per cent in Nova Scotia and 2.5 per cent in Canada.
Major Components for June 2019
The following table shows the price increases specific to Nova Scotia for the major components of the CPI this month:
Long Run Trends
The All-Items CPI year over year inflation rate for Nova Scotia was below Canada's in June 2019. Nova Scotia's annual inflation has remained below the Canadian average since mid-2014, with the exception of only a few months. While month to month movements in the indices can be different, over time they generally follow the same overall trend.
Annual inflation for the CPI excluding food and energy was lower for Nova Scotia (at 2.2 per cent) compared to Canada (2.3 per cent) in June.
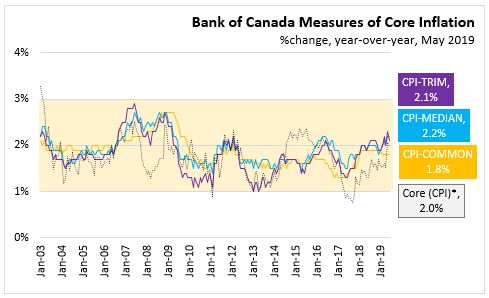
Bank of Canada's preferred measures of core inflation
Compared with June 2018, CPI-Common increased 1.8 per cent, CPI-Median rose 2.2 per cent and CPI-Trim was up 2.1 per cent in Canada. All-items CPI excluding eight of the most volatile components as defined by the Bank of Canada, and excluding the effect of changes in indirect taxes (formerly referred to as CPIX), rose 2.0 per cent year over year.
Appendix Tables and Charts
A NOTE ON CONSUMER PRICE INDEX
On February 27, 2019, with the release of the January 2019 CPI, the basket of goods and services used in the calculation of the CPI was updated using 2017 weights. The base year, in which the CPI is set to equal 100, remains 2002.
The 2017 basket classification system was updated to add new, relevant goods and services, while removing some that are obsolete. Some minor changes will be made to published index titles in order to clarify the definition of some series.
The alcoholic beverages and tobacco products major component has been updated to include recreational cannabis. Additionally, medicinal cannabis has been added under medicinal and pharmaceutical products.
There is also a change to the calculation of the rent index. Month over month changes to the rent index will not be impacted as the previous month has been linked to the current month. However, year over year change calculations should be interpreted with caution, particularly in the year following this implemented change.
Source: Statistics Canada data portal: Tables 18-10-0004-01 and 18-10-0256-01
<--- Return to Archive