The Economics and Statistics Division maintains archives of previous publications for accountability purposes, but makes no updates to keep these documents current with the latest data revisions from Statistics Canada. As a result, information in older documents may not be accurate. Please exercise caution when referring to older documents. For the latest information and historical data, please contact the individual listed to the right.
<--- Return to Archive
For additional information relating to this article, please contact:
August 07, 2019BALTIC DRY INDEX FIRST HALF OF 2019, PLUS RECENT ACTIVITY The BDI measures procurement costs of shipping raw materials by sea. When these costs go down, producers benefit from increased margins, and consumers benefit from lower prices for finished products.
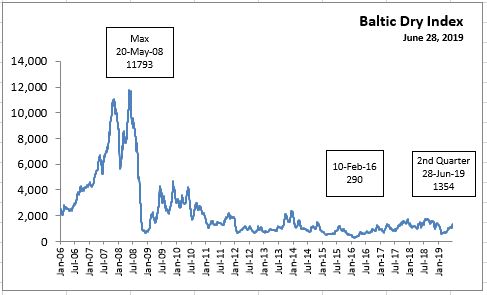
On May 20, 2008, the Baltic Exchange reported the BDI = 11,793 a new high for the index. Before the year was out, the BDI dropped to 663 on 5 December 2008.
On February 10, 2016, the Baltic Exchange reported the BDI = 290 a new low for the index. When the index drops below 500, shipping companies tend to idle their fleets as variable costs cannot be recovered.
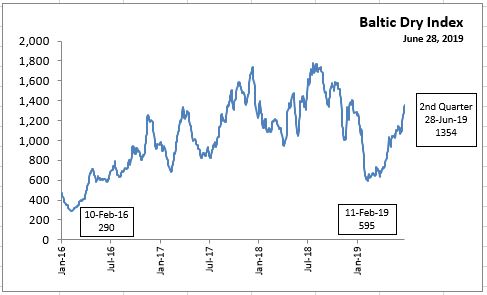
On the last trading day in June 2019, the Baltic Exchange reported the BDI = 1,354, an increase of 1064 points over February 10, 2016.
Recent Activity to August 6, 2019
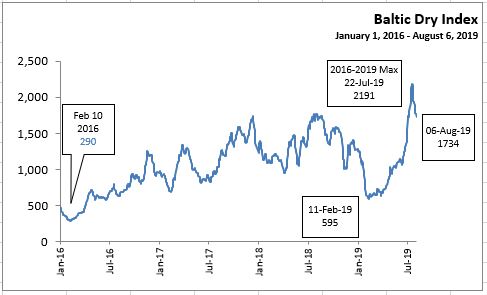
On the last trading day of the current year (August 6, 2019), the Baltic Exchange reported the BDI increased from 595 (February 11, 2019) to a recent high of 2191 (July 22, 2019) before declining to 1734 (August 6, 2019); a net increase of 1444 points over February 10, 2016.
On a year-to-date basis, January 2, 2019 to August 6, 2019, the BDI increased 35.3%.
REFERENCES
LLYod Baltic Dry
CNBC (one year+)
Trading Economics (intercative chart)
Bloomberg (interative chart)
Baltic Dry Index - BDI (BALDRY), wikinvest
The Shipping News
The Baltic Exchange
<--- Return to Archive