The Economics and Statistics Division maintains archives of previous publications for accountability purposes, but makes no updates to keep these documents current with the latest data revisions from Statistics Canada. As a result, information in older documents may not be accurate. Please exercise caution when referring to older documents. For the latest information and historical data, please contact the individual listed to the right.
<--- Return to Archive
For additional information relating to this article, please contact:
September 03, 2019STUDY: MEASURING AND ANALYZING THE GENDER PAY GAP: A CONCEPTUAL AND METHODOLOGICAL OVERVIEW Statistics Canada recently released a report on Measuring and Analyzing the Gender Pay Gap that highlights the conceptual and methodological aspects of the topic. A summary of the report follows.
There is currently not an internationally recognized standard for measuring gender pay gap with the report highlighting the underlying assumptions and implications resulting from various methods. The report is based on sex that is assigned at birth, typically based on biology (anatomy, hormones, and physiology) in contrast to a gender definition that refers to a social category entailing roles, behaviours, activities and attributes that are deemed appropriate for a given sex. Due to data limitations, the report distinguishes men and women on the basis of sex and an assumption that gender, gender identify, and gender expressions are consistent with their sex (i.e. cisgender persons). Future data (i.e. 2021 Census of Population) will include questions on both sex and gender, allowing transgender persons and those with non-binary gender identifies or expression to be distinguished from cisgender persons.
There are two ways of presenting the gender pay gap: 1) Gender pay ratio = women’s earnings expressed as a proportion of men’s earning (i.e. number of cents that women earn for every dollar earned by men), and 2) Gender pay gap = percentage less earned by women than men. The decisions about who is measured (age groups, labour supply of hours), what types of earnings are counted (annual earnings or hourly wages), and how “typical” earnings are calculated will all impact the size of the gender pay gap.
Restricting data to core-working age groups (age 25-54) shows similar results compared to all workers (see chart 1). Differences in methodology also imply different conceptualizations of women’s decision-making about their labour supply. The sociological perspective that individuals’ choices are constrained by social norms and cultural expectations related to gender will inform selection of labour supply and types of occupation. Also, discrimination and expected discrimination can impact women’s decision regarding type of education and occupation. Under these circumstances, both men and women make constrained choices about how much paid work they do, thus estimates of the gender pay gap that are based on limited samples (i.e. full-time, full-year workers) omit the gendered process involved in a woman’s decision about her labour supply. Issues around earnings related to underground economy self-employment income, supplementary medical, dental, pension benefits, pay-for-performance, and stock options can complicate measurements of the relative difference in earnings.

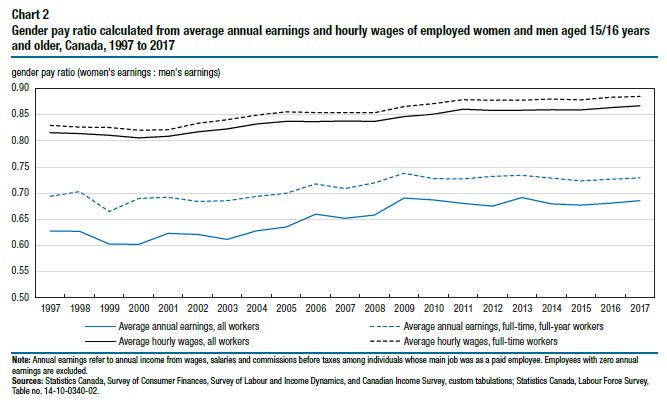
The most inclusive measure of the gender pay gap involves comparison annual earnings of all employed men and women, including those working on part-time or part-year basis. This unrestricted measure captures differences in both hourly pay and labour supply (hours and weeks worked). From 1997-2017 in Canada, the unrestricted measure showed a larger gender pay gap than measures that were based on more limited definitions in terms of examining hourly wage, full-time, and full-year workers (see chart 2). The typical criticism of the unrestricted measure of the gender pay gap is that does not account for gender differences in hours worked; however, its virtue is that it captures the full scope of the financial implications of gender. Annual earnings allow a measurement of purchasing power, material well-being, and pay bonuses, whereas measures of hourly wage do not. Pay equity legislation mandates equal pay for work of equal or comparable value regardless of work hours or term of employment, highlighting the relevance of hourly wage differentials.

The unadjusted gender pay gap can reflect differences in education, work experience, job tenure, occupation, industry, and gender-based discrimination. Statistical methods can be used to control for the relative importance of predictors and generate adjusted gender pay gap measures. Economic explanations for the gender pay gap focus on gender differences in human capital (education, field of study, work experience), occupational/industrial, and discrimination of similarly qualified workers.
There are differences between men and women in occupational categories. In 2017, the 20 occupations with the greatest concentration of women employed 27 per cent of women and only 5 per cent of men. Many of the occupations are related to traditionally-female occupations including teaching, nursing, social work, clerical or administrative, sales and services. Less than 1 per cent of women’s total employment is accounted for within the 20 occupations with the greatest concentration of men. These top 20 occupations with highest concentration of men were related to mining, forestry, manufacturing, construction, and automotive/equipment repair. Differences in occupational choice can be related to social norms; preferences non-pecuniary attributes, job security, earnings stability, injury risk, competitiveness; employers’ conscious or unconscious preferences; crowding effects; or cultural devaluation of work associated with women.
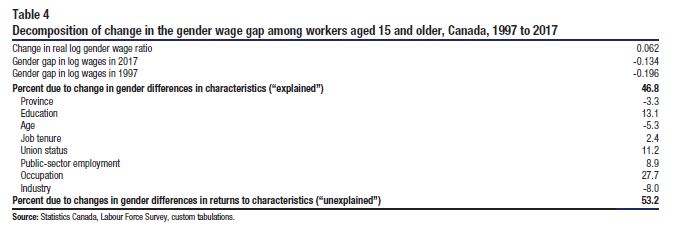
Typical analysis uses statistical technique (Oaxaca-Blinder decomposition) that can be used to understand the relative contribution of human capital, occupation, industry differences in the unadjusted gender pay gap (see table 4). The predictors in such analysis do not explain earnings inequality in a social or cultural sense as the predictors (i.e. education, occupation) are themselves understood to be the outcomes of gendered processes. A decomposition for 1997 to 2017 has the gender pay gap decreasing with around half of the change being explained due to changes in relative characteristics between genders. The increases of women in high-paying managerial and professional occupations and with university degrees were the largest factors. Also contributing to the decrease in the gender wage gap was women’s increased job tenure, lower union coverage among men, and increased proportion of women in the public sector.

As the gender wage gap has narrowed over time, the proportion that is unexplained by the typical predictors has risen. In 2017, nearly 70 per cent of the gender wage gap is not explained by gender differences related to province, human capital, union status, public sector employment, occupation or industry. Other explanation for the “remaining” gender pay gap include 1) motherhood earning penalty through lower human capital investment, preference to trade work-life balance for earnings, or discrimination, 2) Preference and need for temporal flexibility in segments of corporate, financial, legal sectors which place high importance on long work hours, set schedules, face time, and worker availability, and/or 3) Gender differences in personality traits, psychological attributes and non-cognitive skills whether genetically or cultural determined. These can be related to the importance of money, risk aversion, and differences in the relative return of personality traits between men and women.
Understanding trends in the gender pay gap require analysis across a variety of factors – composition of labour force, business cycle patterns, technological and globalization factors that have changed wage distribution, age and cohort effects. Studies show that the gender pay gap is smallest among younger people but grows as people age and form families. Women’s employment is shaped to greater extent by caregiving roles and employers’ presumptions of these roles. As they age women work fewer hours outside home and more likely to experience work interruptions. The gender pay gap also shows signs of decreasing based on successive cohorts with decreases among each age group comparing 1997 to 2017. (see table 5).

The report notes that the unadjusted gender pay gap is an important indicator and that analyst’s decisions regarding what and how it is measured affect the size and perceived seriousness of the gender pay gap. Statistical analysis that controls for various predictors should not be interpreted as evidence that gender pay gap is inconsequential.
Source: Statistics Canada. Daily Release; Full Report
<--- Return to Archive