The Economics and Statistics Division maintains archives of previous publications for accountability purposes, but makes no updates to keep these documents current with the latest data revisions from Statistics Canada. As a result, information in older documents may not be accurate. Please exercise caution when referring to older documents. For the latest information and historical data, please contact the individual listed to the right.
<--- Return to Archive
For additional information relating to this article, please contact:
September 09, 2019UK TRADE BALANCE, JULY 2019 UK import and export trade is a main contributor to the overall economic growth of the UK.
Month-over-month
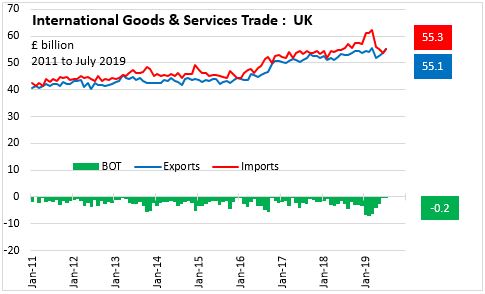
In July 2019, the UK seasonally adjusted goods & services trade deficit widened by £0.1 billion to £0.2 billion. Exports of goods and services increased 2.5% (£1.4 billion) to £55.1 billion while, imports of goods and services increased 2.7% (£1.5 billion) to £55.3 billion.
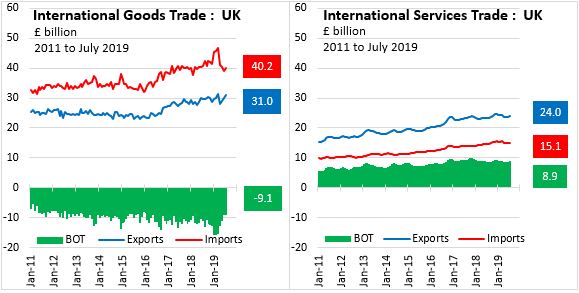
In July 2019, Exports of goods increased 3.5% (£1.052 billion) to £31.0 billion while imports of goods increased 3.3% (£1.276 billion) to £40.2 billion. The resulting goods deficit widened by 2.5% (£0.224 billion) to £9.1 billion.
In July 2019, Exports of services increased 1.3% (£0.316 billion) to £24.0 billion while imports of services increased 1.20% (£0.179 billion) to £15.1 billion. The resulting services surplus widened by 1.6% (£0.137 billion) to £8.9 billion.
UK International Trade EU and Non-EU
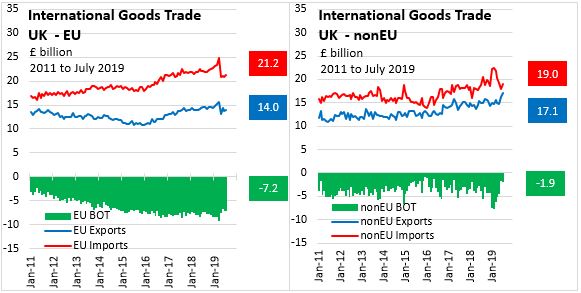
In July 2019, goods exports with non-European Union countries increased 5.2% (£0.848 billion) to £17.1 billion, while goods imports from non-EU28 countries increased 5.6% (£1.009 billion) to £19.0 billion. The resulting goods deficit widened by 9.1% (£0.161 billion) to £1.9 billion.
In July 2019, goods exports to the European Union (EU28) increased 1.5% (£0.204 billion) to £14.0 billion, while goods imports from the European Union increased 1.3% (£0.267 billion) to £21.2 billion. The resulting goods deficit widened by 0.9% (£0.063 billion) to £7.2 billion.
Year-to-date Goods Export Trade by Sector
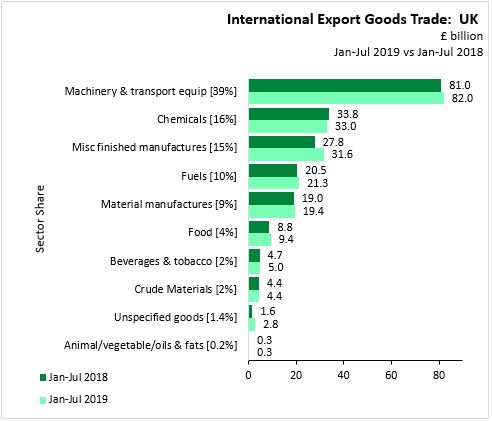
In Jan-Jul 2019, Machinery & transport equip sector, accounting for 39% of goods exports, increased 1.3% (£1.1 billion) to £82.0 billion.
- Chemicals sector, accounting for 16% of goods exports, decreased 2.5% (£0.8 billion) to £33.0 billion.
- Misc finished manufactures sector, accounting for 15% of goods exports, increased 13.7% (£3.8 billion) to £31.6 billion.
- Fuels sector, accounting for 10% of goods exports, increased 3.7% (£0.8 billion) to £21.3 billion.
- Material manufactures sector, accounting for 9% of goods exports, increased 2.1% (£0.4 billion) to £19.4 billion.
- Food sector, accounting for 4% of goods exports, increased 5.8% (£0.5 billion) to £9.4 billion.
- Beverages & tobacco sector, accounting for 2% of goods exports, increased 7.6% (£0.4 billion) to £5.0 billion.
- Crude Materials sector, accounting for 2% of goods exports, increased 0.2% (£0.0 billion) to £4.4 billion.
- Unspecified goods sector, accounting for 1.4% of goods exports, increased 72.9% (£1.2 billion) to £2.8 billion.
- Animal/vegetable/oils & fats sector, accounting for 0.2% of goods exports, decreased 1.6% (£0.005 billion) to £0.3 billion.
Year-to-date Goods Import Trade by Sector
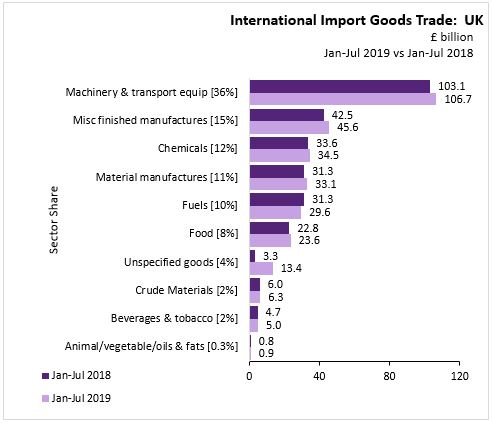
In Jan-Jul 2019,
- Machinery & transport equip sector, accounting for 36% of goods imports, increased 3.5% (£3.6 billion) to £106.7 billion.
- Chemicals sector, accounting for 15% of goods imports, increased 7.2% (£3.1 billion) to £45.6 billion.
- Misc finished manufactures sector, accounting for 12% of goods imports, increased 2.5% (£0.9 billion) to £34.5 billion.
- Fuels sector, accounting for 11% of goods imports, increased 5.5% (£1.7 billion) to £33.1 billion.
- Material manufactures sector, accounting for 10% of goods imports, decreased 5.6% (£1.7 billion) to £29.6 billion.
- Food sector, accounting for 8% of goods imports, increased 3.3% (£0.8 billion) to £23.6 billion.
- Beverages & tobacco sector, accounting for 4% of goods imports, increased 304.0% (£10.0 billion) to £13.4 billion.
- Crude Materials sector, accounting for 2% of goods imports, increased 5.3% (£0.3 billion) to £6.3 billion.
- Unspecified goods sector, accounting for 2% of goods imports, increased 6.5% (£0.3 billion) to £5.0 billion.
- Animal/vegetable/oils & fats sector, accounting for 0.3% of goods imports, increased 0.8% (£0.01 billion) to £0.9 billion.
Year-to-date Goods Net Trade by Sector
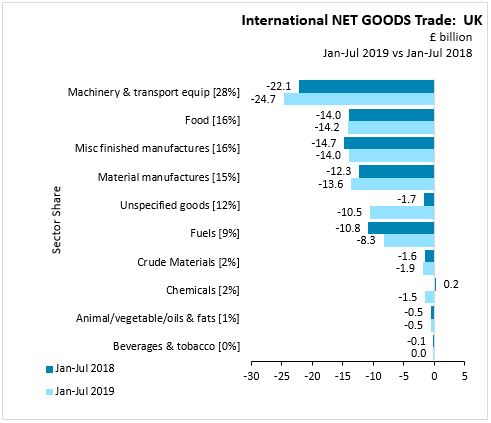
In Jan-Jul 2019,
- Machinery & transport equip sector, accounting for 28% of net goods trade, increased 11.5% (£2.6 billion) to -£24.7 billion.
- Food sector, accounting for 16% of net goods trade, increased 1.8% (£0.3 billion) to -£14.2 billion.
- Misc finished manufactures sector, accounting for 16% of net goods trade, decreased 5.0% (£0.7 billion) to -£14.0 billion.
- Material manufactures sector, accounting for 15% of net goods trade, increased 10.9% (£1.3 billion) to -£13.6 billion.
- Unspecified goods sector, accounting for 12% of net goods trade, increased 532.4% (£8.8 billion) to -£10.5 billion.
- Fuels sector, accounting for 9% of net goods trade, decreased 23.1% (£2.5 billion) to -£8.3 billion.
- Crude Materials sector, accounting for 2% of net goods trade, increased 19.6% (£0.3 billion) to -£1.9 billion.
- Chemicals sector, accounting for 2% of net goods trade, decreased 836.3% (£1.7 billion) to -£1.5 billion.
- Animal/vegetable/oils & fats sector, accounting for 1% of net goods trade, increased 2.3% (£0.012 billion) to -£0.5 billion.
- Beverages & tobacco sector, accounting for 0% of net goods trade, decreased 94.3% (£0.05 billion) to £0.00 billion
Source: UK Office for National Statistics, Statistical Bulletin | Time Series | Time Series Explorer
<--- Return to Archive