The Economics and Statistics Division maintains archives of previous publications for accountability purposes, but makes no updates to keep these documents current with the latest data revisions from Statistics Canada. As a result, information in older documents may not be accurate. Please exercise caution when referring to older documents. For the latest information and historical data, please contact the individual listed to the right.
<--- Return to Archive
For additional information relating to this article, please contact:
October 01, 2019CANADA GDP BY INDUSTRY, JULY 2019 
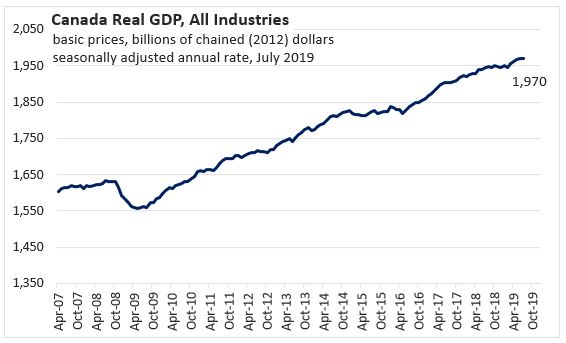
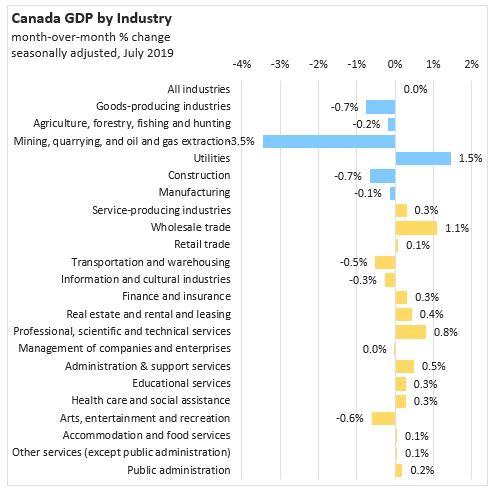
Real GDP in Canada was unchanged (+0.0 per cent) in July following four months of growth. Goods-producing industries declined 0.7 per cent after a 0.2 per cent decline the previous month. Service-producing industries were up for the fifth consecutive month with a 0.3 per cent gain. Compared to July 2018, the Canadian economy is 1.3 per cent larger with an annualized value of $1,970 billion (chained 2012 dollars) in July 2019.
Oil and gas extraction contracted 3.0 per cent in July with the largest monthly decline in a decade in the oil and gas extraction (except oil sands) as offshore production in Newfoundland and Labrador was shutdown for maintenance issues. Oil sands extraction was down 1.0 per cent. Support activities for mining, oil and gas extraction declined 11.5 per cent as drilling and rigging services contracted.
The construction sector was down 0.7 per cent in July, largely offsetting growth in previous two months. Residential construction was down as declines in multi-units and home alterations offset gain in single-home construction. Engineering and repair construction were down, but non-residential building construction continues to grow in commercial, industrial and public sector. Activities at offices of real estate agents and brokers was up 4.2 per cent July, the fifth consecutive monthly gain due to higher housing resale activity in the Greater Vancouver Area, the Greater Toronto Area, and the Fraser Valley.
Manufacturing was down 0.1 per cent after a 1.3 per cent decline last month. Inventory formation moderated some of the sales declines. Durable manufacturing was down with declines in 6 of 10 subsectors. Non-durable manufacturing growth was broad-based with notable gains in food, and plastic and rubber products.
Wholesale trade was up for the sixth time in past seven months. Growth was led by personal and household goods and motor vehicles. There were record-high imports of pharmaceutical products, mainly from Switzerland and Germany. Retail trade was up 0.6 per cent in June and 0.1 per cent in July. Gains were seen in health and personal care stores, motor vehicles and parts dealers, but notable declines in building materials, clothing and gasoline stations.
Legal services gains were driven by real estate transactions. Finance and insurance sector was up on banking and investment offsetting a decline in insurance carriers. Transportation and warehousing was down 0.5 per cent in July on lower rail transportation of petroleum products, chemicals, metals and minerals.
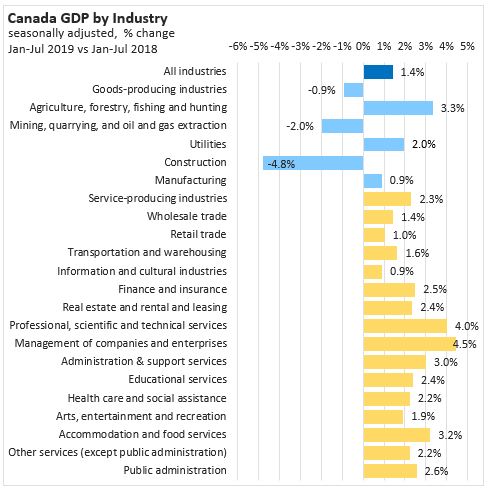
Comparing the size of the Canadian economy in January-July 2019 with January-July 2018, there has been a 1.4 per cent increase due to higher service sector output (+2.3 per cent) while the goods-producing sector declined by 0.9 per cent. Higher levels of activity in agriculture, forestry, fishing and hunting, utilities and manufacturing only partially offset the lower levels of activity in mining, quarrying, and oil and gas extraction and construction. Service sector output is higher across all subsectors with the largest increases in management of companies, professional, scientific and technical services, and accommodations and food services subsectors.
Source: Statistics Canada.
Table 36-10-0434-01 Gross domestic product (GDP) at basic prices, by industry, monthly (x 1,000,000)
<--- Return to Archive