The Economics and Statistics Division maintains archives of previous publications for accountability purposes, but makes no updates to keep these documents current with the latest data revisions from Statistics Canada. As a result, information in older documents may not be accurate. Please exercise caution when referring to older documents. For the latest information and historical data, please contact the individual listed to the right.
<--- Return to Archive
For additional information relating to this article, please contact:
December 17, 2019MANUFACTURING SHIPMENTS, OCTOBER 2019 CANADA

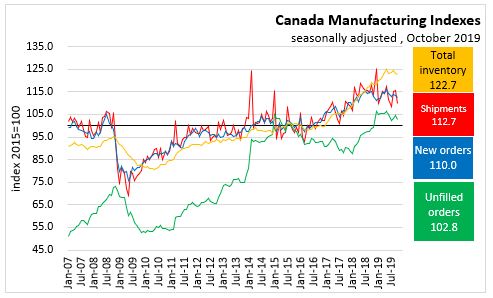
In Canada October 2019, seasonally adjusted Manufacturing Shipments decreased 0.7% to $57.1 billion over September 2019 and decreased 2.1% over October 2018.
Compared to September 2019, overall sales decreased in 11 of 21 industries representing 48.8% of all manufacturing sectors. Durable goods decreased 2.4% to $29.9 billion over Sep 2019 and increased 0.1% over October 2018. Non-durable goods increased 1.3% to $27.2 billion over Sep 2019 and decreased 4.3% over October 2018.
Inventory to sales ratio increased to 1.54 in October. Unfilled orders fell 1.5% to $97.6 billion. Unfilled orders were down in 16 of 21 industries with the largest in transportation equipment, and fabricated metal product industries. New orders fell 4.9% to $55.6 billion over September 2019
PROVINCES
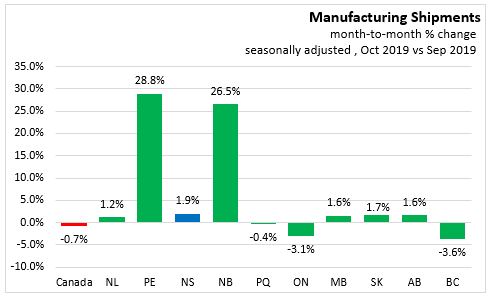
On a seasonally adjusted, month-over-month basis, Manufacturing sales increased in 7 provinces in October 2019 over September 2019. Prince Edward Island had the largest growth at 28.8% British Columbia shipment growth decreased 3.6%. Nova Scotia shipments increased 1.9%. In Canada shipments decreased 0.7%.
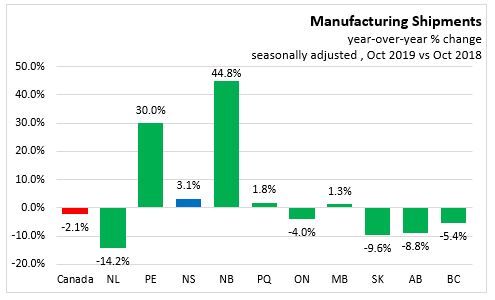
On a seasonally adjusted year-over-year basis, Manufacturing sales increased in 5 provinces in October 2019 over October 2018. New Brunswick had the largest growth at 44.8%. Newfoundland and Labrador shipment growth decreased 14.2%. Nova Scotia shipments increased 3.1%. In Canada shipments decreased 2.1%.
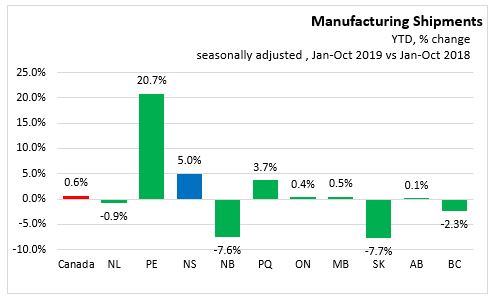
On a seasonally adjusted, year-to-date basis, Manufacturing sales increased in 6 provinces in Jan-Oct 2019. Prince Edward Island had the largest growth at 20.7%. Saskatchewan shipment growth decreased 7.7%. Nova Scotia shipments increased 5.0%. In Canada shipments increased 0.6%.
NOVA SCOTIA
Seasonally Adjusted
Month-over-month
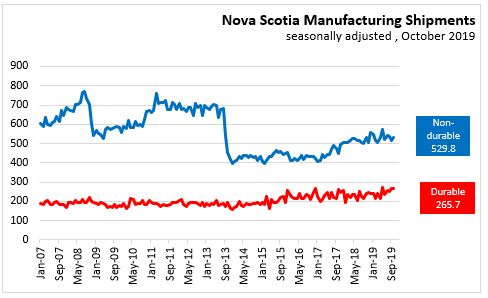
In Nova Scotia October 2019, seasonally adjusted Manufacturing Shipments increased 1.9% to $795.4 million over September 2019 and increased 3.1% over October 2018.
Nova Scotia manufacturing shipments have been on an upward trend since the beginning of 2014 with rising durable (i.e. wood products, metal products, machinery, transportation equipment) and rising non-durable (i.e. food, paper/pulp, chemical, plastic and rubber) shipments. Seasonally adjusted non-durable shipments have risen from $405.4 million in January 2014 to $529.8 million in October 2019. Durable shipments have increased from $170.1 million in January 2014 to $265.7 million in October 2019.
Year-to-date
In Nova Scotia Jan-Oct 2019, seasonally adjusted Manufacturing Shipments increased 5.0% ($370.2 million) to $7.8 billion. Non-durable goods industries, accounting for 68% of Manufacturing Shipments, increased 3.2% ($163.0 million) to $5.3 billion. Durable goods industries, accounting for 32% of Manufacturing Shipments, increased 9.2% ($207.3 million) to $2.5 billion.
NOVA SCOTIA SECTORS
Unadjusted

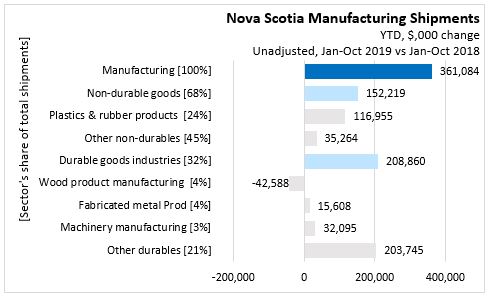
Unadjusted year-to-date (Jan-Oct 2019), Manufacturing Shipments increased 4.8% ($361.1 million) over the same period last year.
- Non-durable goods shipments, accounting for 68% of Manufacturing Shipments, increased 2.9% ($152.2 million),
- Plastics & rubber products with a 24% share increased 6.8% ($117.0 million).
- Other non-durables with a 45% share increased 1.0% ($35.3 million).
- Durable goods industries with a 32% share increased 9.2% ($208.9 million).
- Wood product manufacturing with a 4% share decreased 11.1% ($42.6 million).
- Fabricated metal Prod with a 4% share increased 5.9% ($15.6 million).
- Machinery manufacturing with a 3% share increased 18.6% ($32.1 million).
- Other durables with a 21% share increased 14.1% ($203.7 million).
CENSUS METROPOLITAN AREAS (CMA) SECTORS
HALIFAX CMA

In Halifax, unadjusted non-durable shipments have risen from $52.2 million in January 2014 to $92.6 million in October 2019. Durable shipments have increased from $74.5 million in January 2014 to $144.3 million in October 2019.
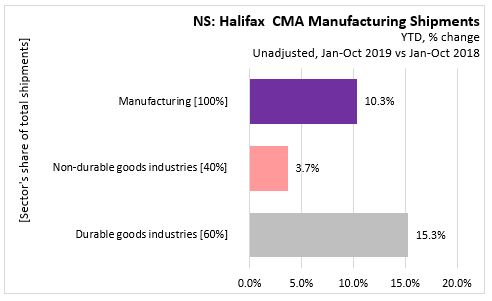
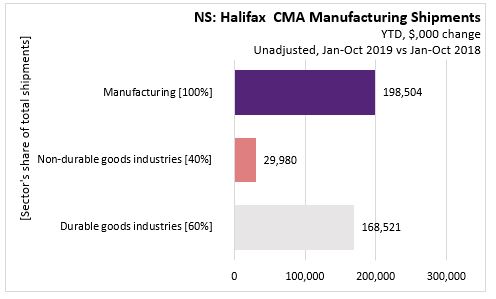
In Halifax, year-to-date unadjusted non-durable shipments have risen 3.7% ($30.0 million) in Jan-Oct 2019 to $851.1 million over Jan-Oct 2018. Durable shipments have increased 15.3% ($168.5 million) to $1.3 billion. Manufacturing shipments increased 10.3% ($198.5 million) to $2.1 billion.
THE REST OF NOVA SCOTIA

In the rest of Nova Scotia, unadjusted non-durable shipments have risen from $303.1 million in January 2014 to $470.4 million in October 2019. Durable shipments have increased from $74.3 million in January 2014 to $137.5 million in October 2019.
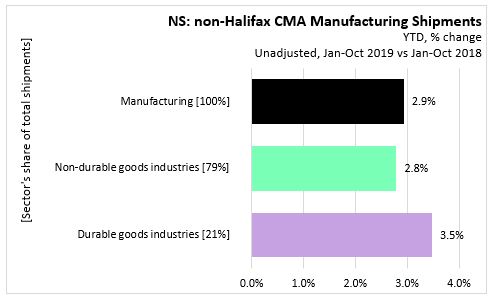
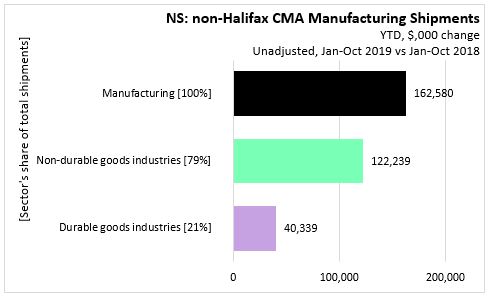
In the rest of Nova Scotia, year-to-date unadjusted non-durable shipments have risen 2.8% ($122.2 million) in Jan-Oct 2019 to $4.5 billion over Jan-Oct 2018. Durable shipments have increased 3.5% ($40.3 million) to $1.2 billion. Manufacturing shipments increased 2.9% ($162.6 million) to $5.7 billion.
SOURCES
Statistics Canada Monthly survey of Manufacturing
Statistics Canada. Table 16-10-0047-01 Manufacturers' sales, inventories, orders and inventory to sales ratios, by industry (dollars unless otherwise noted)
Statistics Canada. Table 16-10-0048-01 Manufacturing sales by industry and province, monthly (dollars unless otherwise noted) (x 1,000)
Statistics Canada. Table 16-10-0011-01 Manufacturing sales, by industry for 12 Selected Census Metropolitan Areas (x 1,000)
<--- Return to Archive