The Economics and Statistics Division maintains archives of previous publications for accountability purposes, but makes no updates to keep these documents current with the latest data revisions from Statistics Canada. As a result, information in older documents may not be accurate. Please exercise caution when referring to older documents. For the latest information and historical data, please contact the individual listed to the right.
<--- Return to Archive
For additional information relating to this article, please contact:
January 06, 2020NOVA SCOTIA TOTAL TRADE 2018 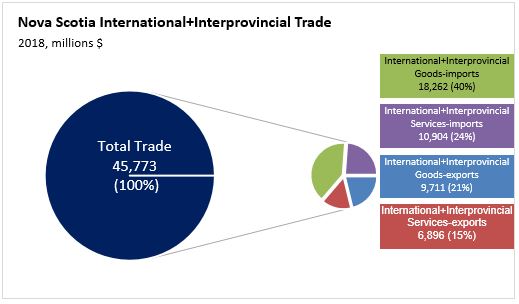
The Nova Scotia provincial economic accounts provide the best measures of Nova Scotia's trade. The robustness of the data and consistency with the overall value of GDP allows for the derivation of many indicators that provide significant insight on how Nova Scotia's economy interacts with the rest of the world.
Total trade is a measure of all external trade activity, including imports, exports, goods, services as well as international and interprovincial destinations.
In 2018, in order by value, they are:
- International + Interprovincial Imports of Goods ($18.262 billion);
- International + Interprovincial Imports of Services ($10.904 billion);
- International + Interprovincial Exports of Goods ($9.711 billion); and
- International + Interprovincial Exports of Services ($6.896 billion);
- Summed, Nova Scotia's total trade amounts to $45.773 billion.
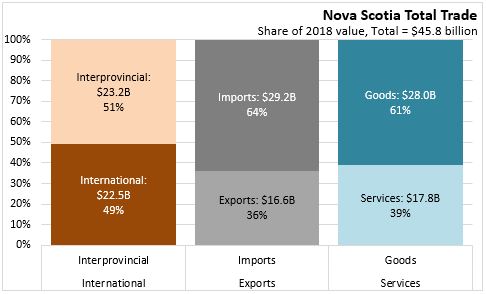
Nova Scotia's total trade can be broken down by three categories, allowing for comparison of the relative significance of each major dimension of Nova Scotia's trade.
Destination: Interprovincial trade (exports+imports, goods+services) amounted to $23.237 billion (51 per cent of total trade) while international trade (exports+imports, goods+services) amounted to $22.536 billion (49 per cent of total trade)
Direction: Imports (international+interprovincial, goods+services) amounted to $29.166 billion (64 per cent of total trade) while exports (international+interprovincial, goods+services) amounted to $16.607 billion (36 per cent of total trade)
Product: Goods (international+interprovincial, exports+imports) amounted to $27.973 billion (61 per cent of total trade) while services (international+interprovincial, exports+imports) amounted to $17.800 billion (39 per cent of total trade).
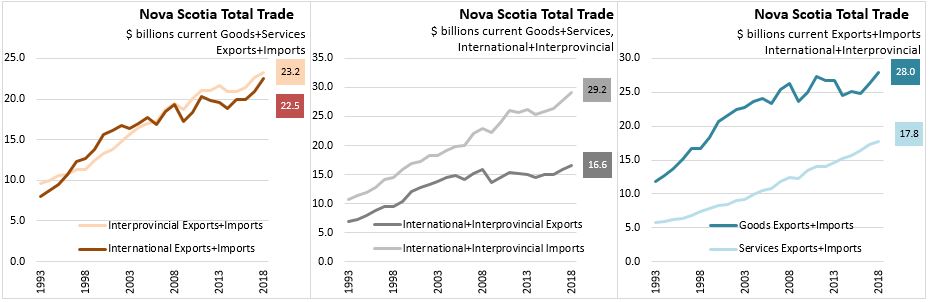
INTERNATIONAL TRADE GROWTH
In 2018, the value of Nova Scotia's GDP increased 3.3 per cent (from 2017) to $44.4 billion. In comparison:
- Imports of Goods and Services (international+interprovincial) increased 5.4 per cent to $29.166 billion, including imports of Goods (international+interprovincial) increasing 6.7 per cent to $18.262 billion and imports of Services (international+interprovincial) increasing 3.3 per cent to $10.904 billion.
- Exports of Goods and Services (international+interprovincial) increased 4.8 per cent to $16.607 billion, including exports of Goods (international+interprovincial) increasing 5.9 per cent to $9.711 billion and exports of Services (international+interprovincial) increasing 3.2 per cent to $6.896 billion.
- Interprovincial trade (exports+imports, goods+services) increased 2.7 per cent to $23.237 billion.
- International trade (exports+imports, goods+services) increased 7.9 per cent to $22.536 billion.
- Goods trade (international+interprovincial, exports+imports) increased 6.5 per cent to $27.973 billion.
- Services trade (international+interprovincial, exports+imports) increased 3.2 per cent to $17.8 billion.
From 2010 to 2018, Nova Scotia's nominal GDP grew at an annual average pace of ranking the components of Total trade and nominal GDP by percentage growth over the period yields the following:
- Imports of Goods and Services (international+interprovincial) increased at an annual average rate of 2.5 per cent, including imports of Goods (international+interprovincial) increasing at an annual average rate of 1.9 per cent and imports of Services (international+interprovincial) increasing at an annual average rate of 3.4 per cent.
- Exports of Goods and Services (international+interprovincial) increased at an annual average rate of 1.8 per cent, including exports of Goods (international+interprovincial) increasing at an annual average rate of 0.6 per cent, and exports of Services (international+interprovincial) increasing at an annual average rate of 3.7 per cent.
- Interprovincial trade (exports+imports, goods+services) increased at an annual average rate of 1.8 per cent.
- International trade (exports+imports, goods+services) increased at an annual average rate of 2.6 per cent.
- Goods trade (international+interprovincial, exports+imports) increased at an annual average rate of 1.4 per cent.
- Services trade (international+interprovincial, exports+imports) increased at an annual average rate of 3.5 per cent.
Statistics Canada Tables 36-10-0222-01
<--- Return to Archive