The Economics and Statistics Division maintains archives of previous publications for accountability purposes, but makes no updates to keep these documents current with the latest data revisions from Statistics Canada. As a result, information in older documents may not be accurate. Please exercise caution when referring to older documents. For the latest information and historical data, please contact the individual listed to the right.
<--- Return to Archive
For additional information relating to this article, please contact:
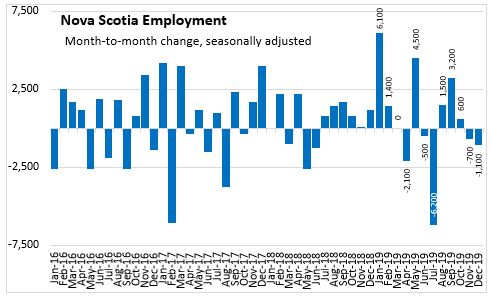
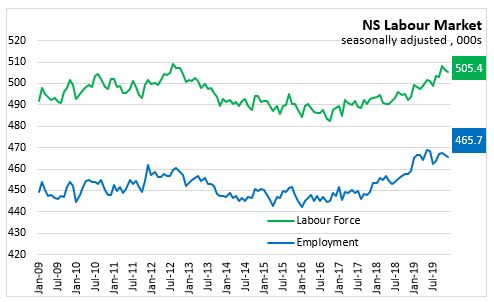
January 10, 2020LABOUR MARKET TRENDS - DECEMBER 2019 Nova Scotia's seasonally adjusted employment level was down 1,100 in December to 465,700. Employment is 6,700 higher than it was last December.
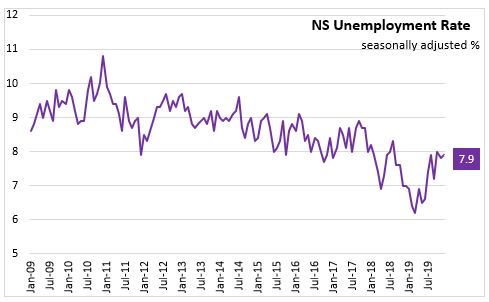
Nova Scotia's employment decrease in December follows a decrease in November and increases in August, September and October. Nova Scotia’s labour force decreased by 1,000 last month to 505,400 for December. With an employment decrease that is larger than the decrease in the labour force the number of unemployed increased by 100 persons. The unemployment rate rose 0.1 percentage points to 7.9 per cent in December.
In December, full-time employment increased by 1,500 while part-time employment was down 2,600 persons. Note: Changes in part-time and full-time employment can include the net impacts of changing hours of work within the same position.
The year-over-year (Dec-19 vs Dec-18) increase in employment of 6,700 includes an increase of 4,500 in full-time employment and an increase of 2,200 in part time employment. The unemployment rate was up 0.9 percentage points compared to December 2018.
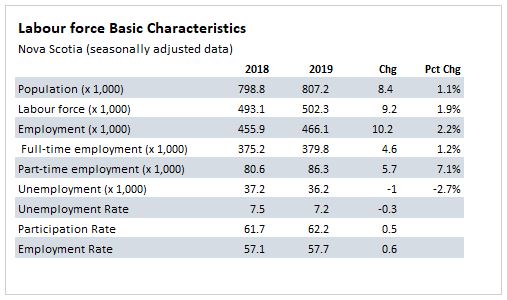
Comparing 2019 with 2018, the labour force grew by 9,200 (+1.9%) while employment was up by 10,200 (+2.2%). This pushed the year-to-date average unemployment rate down from 7.5 per cent in 2018 to 7.2 per cent in 2019.
Age Cohorts
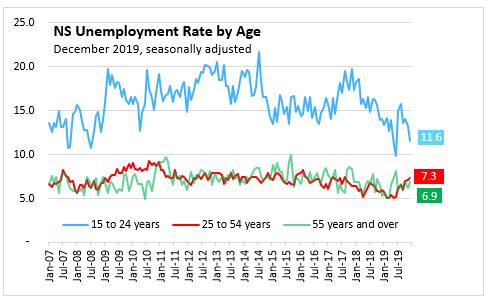
Unemployment rates decreased for younger workers in December. The unemployment rate for those aged 15-24 decreased 1.7 percentage points to 11.6 per cent. For those in the 25-54 year old age cohort the unemployment rate increased 0.2 percentage points to 7.3 per cent and for those aged 55 years and older the unemployment increased 0.7 percentage points to 6.9 per cent.
Age Cohort: Annual
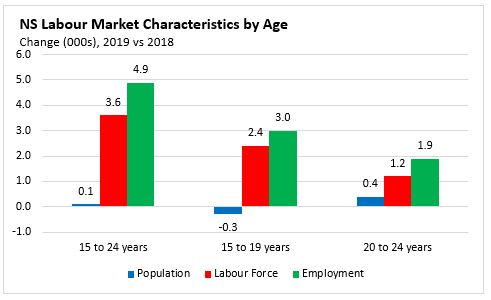
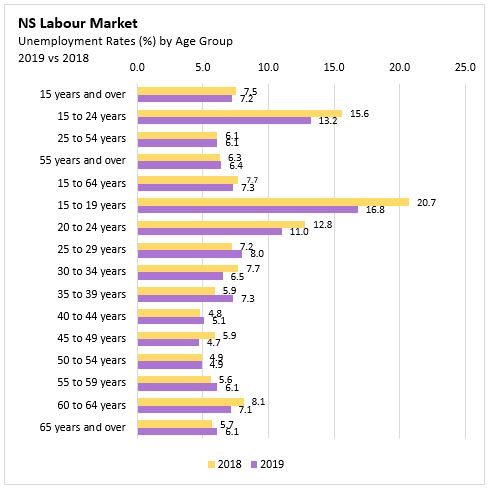
Comparing 2019 with 2018, the youth cohort (aged 15-24) saw only a 100 change in population along with an increase in both the labour force (+3,600, +5.0 per cent) and employment (+4,900, +8.1 per cent). The decline in the number of unemployed (-1,300) resulted in the unemployment rate for 15-24-year olds declining 2.4 percentage points to 13.2 per cent on average over 2019.
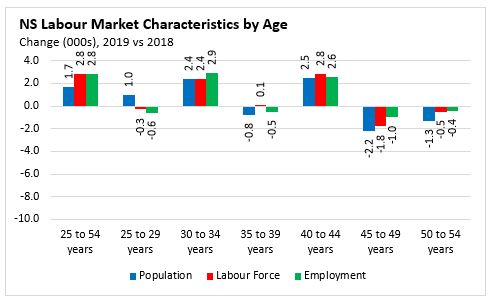
Within the 25-54 age cohort, population growth (+1,700) was less than the increase in labour force (+2,800, +0.9 per cent) and employment (+2,800, +1.0 per cent). The number of unemployed was unchanged and the unemployment rate was unchanged at 6.1 per cent.
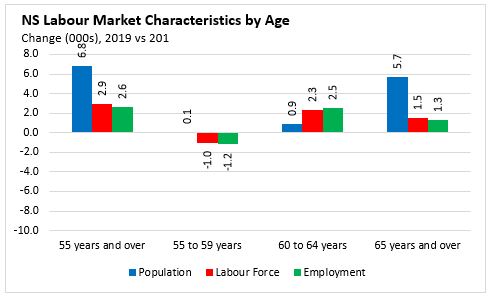
For 2019, older workers (55+) reported increases in population (+6,800), labour force (+2,900, +2.5 per cent) and employment (+2,600, +2.4 per cent). Employment grew slightly slower than labour force, increasing the number of unemployed (+300). The unemployment rate for older workers increased 0.1 percentage points over last year to an average 6.4 per cent 2019.
Males and Females
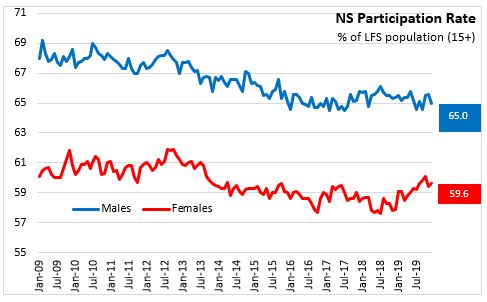
The male participation rate decreased 0.6 percentage points to 65.0 per cent in December 2019. The participation rate for females was up 0.2 percentage points to 59.6 per cent compared to last month and has risen 1.7 percentage points from 57.9 per cent in December 2018.
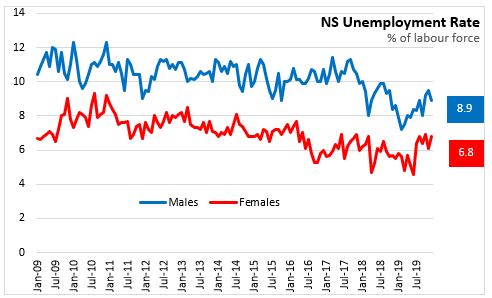
For December 2019, monthly employment decreased by 100 among males and by 1,000 among females. The labour force was down 1,900 among males and increased 800 among females. The male unemployment rate fell to 8.9 per cent and the female unemployment rate increased to 6.8 per cent.
Males and Females: Annual
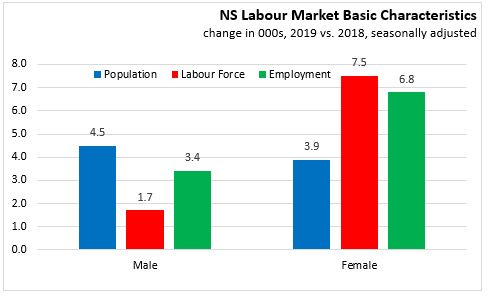
For 2019 compared to 2018, female labour force (+7,500, +3.1 per cent) and employment (+6,800, +3.0 per cent) gains outpaced population growth (+3,900). The unemployment rate among females increased 0.1 percentage points to average 6.0 per cent over 2019.
For 2019, the male population has increased by 4,500. The male labour force has increased by 1,700 (+0.7 per cent) while employment among males increased by 3,400 (+1.5 per cent). The larger increase in employment than labour force resulted in the unemployment rate among males declining by 0.7 percentage points to 8.4 per cent for 2019.
Sectors
Monthly employment decline in December reflected declines in employees in both the public sector (-600) and private sector (-1,600) and an increase in self-employed (1,100). Monthly employment in December was up 1,500 in goods industries, notably in Manufacturing (+2,700), and declined 2,700 in service sectors with the largest declines in wholesale/retail trade (-1,200) and information, culture and recreation (-1,700).
Sectors – Annual
Looking at the results by class of worker for 2019, employment increases for the private sector (12,800) and the public sector (1,400) outweigh the decline in self-employment (-4,100). Over 2019, Nova Scotia averaged 294,900 private sector employees, 114,600 public sector employees, and 56,500 in self-employment.
Among goods-producing sectors, for 2019, employment increases were seen in fishing (+1,800), construction (+1,200) and mining (+00). Employment declined in forestry and logging (-400) and utilities (-100) while manufacturing was little changed (+200).
Services-producing industries averaged 6,300 more jobs compared 2018. The largest increases come from Health care and social assistance (+5,300), Retail Trade (+2,000), with a smaller increases among wholesale, transportation and warehousing, finance and insurance, professional services, information, culture and recreation, accommodation and food services and public administration. There were declines in Other services (-1,800), real estate and rental services (-1,400), educational services (-600), and Business, building and other support services (-300, including call centres).

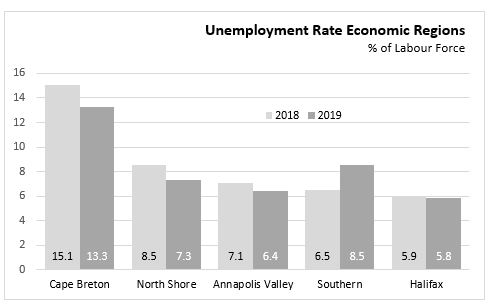
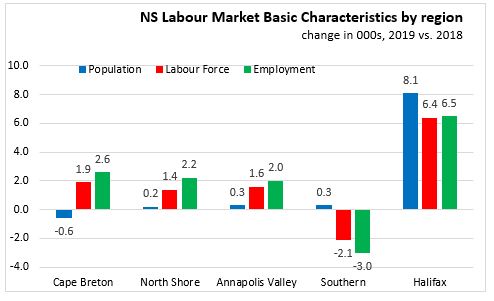
Regions – Annual
Comparing 2019 with 2018, Cape Breton employment is up (+2,600) while the labour force increased by 1,900. The number of unemployed declined 700 and the unemployment rate fell 1.8 percentage points to13.3 per cent.
For the North Shore region, the labour force increased by 1,400 while employment increased by 2,200. With labour force growing slower than employment, the number of unemployed declined by 800. This caused a 1.2 percentage point drop in the unemployment rate from 8.5 per cent to 7.3 per cent.
The Annapolis Valley reported an increase of 2,000 in employment along with an increase of 1,600 in the labour force. Unemployment declined 300 and the net result was a decline in the average unemployment rate by 0.7 percentage points to 6.4 per cent.
The Southern region had an decrease of 3,000 in employment along with a decrease of 2,100 in labour force. The unemployment rate increased 2.0 percentage points to 8.5 per cent in 2019.
Halifax experienced an increase of 6,500 in employment along with an increase of 6,400 in the labour force. With unemployment declining 100, there was a decrease of 0.1 percentage points decline in the unemployment rate to 5.8 per cent in Halifax.
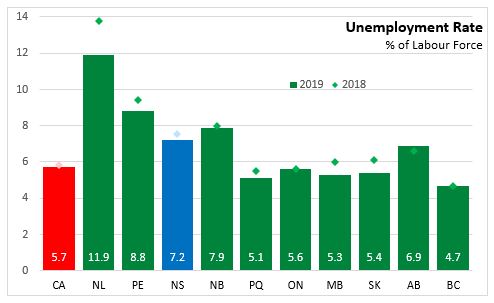
Provincial Comparisons
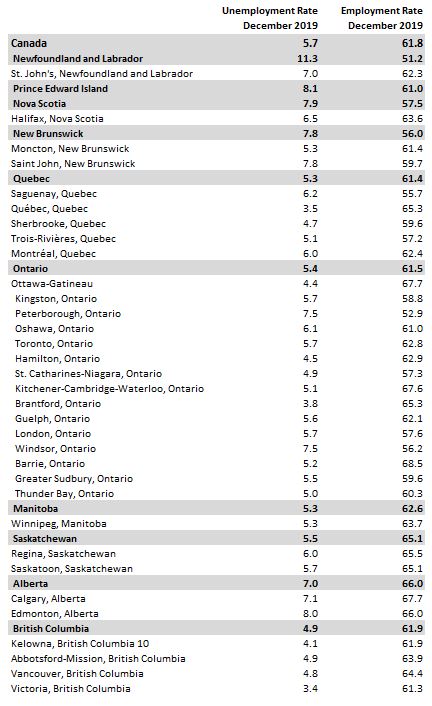
The Nova Scotia unemployment rate was 7.2 per cent in 2019 decreasing from 7.5 per cent the previous year. Canada’s unemployment rate declined 0.1 percentage points to 5.7 per cent in 2019.
Only Alberta reported a higher unemployment rate in 2019 than 2018 but unemployment rates were unchanged in British Columbia and Ontario. The largest decline in the unemployment rate occurred in Newfoundland and Labrador (-1.9 percentage points). The lowest unemployment rate in 2019 was in British Columbia (4.7%) and the highest was in Newfoundland and Labrador at 11. 9 per cent.
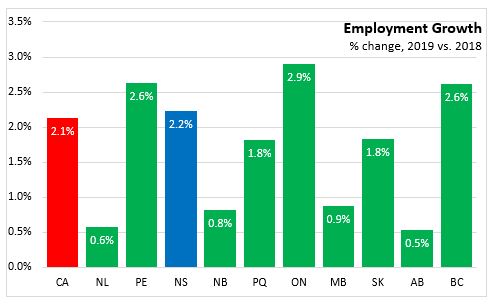
Employment was up in all provinces in 2019. The largest gains in percentage terms was seen in Ontario (+2.9%) and British Columbia and Prince Edward Island (both +2.6%). Nova Scotia (+2.2%) employment growth was the fourth highest. Nationally, employment rose 2.1 per cent in 2019.
National Comparisons: Cities (Monthly)
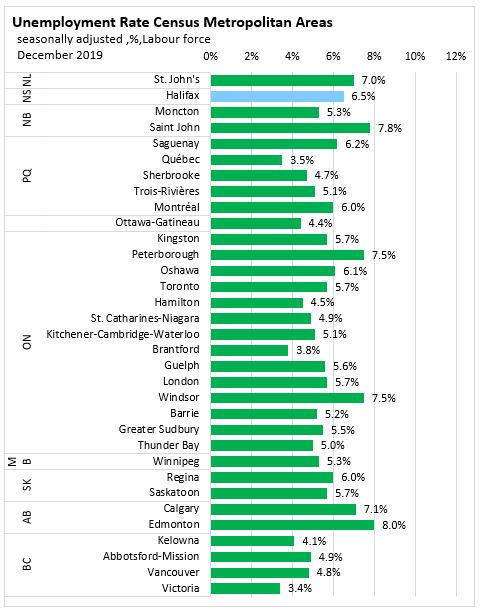
The seasonally adjusted unemployment rate for the Halifax Census Metropolitan Area (CMA) in December 2019 was 6.5 per cent (3 month moving average). Victoria, British Columbia (3.4 per cent) had the lowest unemployment rate among CMAs while the highest was in Edmonton (8.0 per cent).
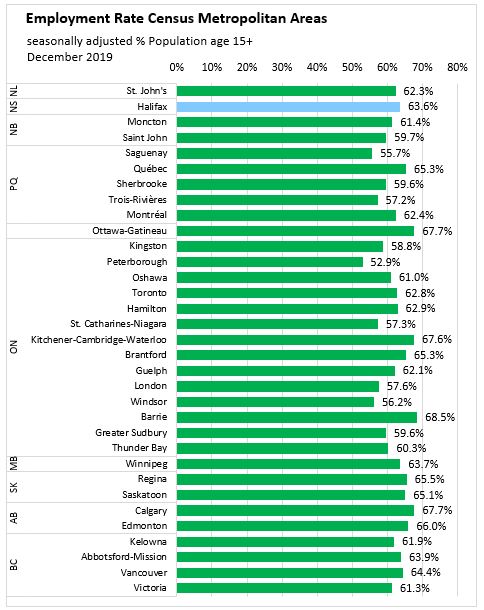
The seasonally adjusted employment rate for the Halifax was 63.6 per cent, down 0.6 percentage points compared to last month. Peterborough, Ontario (52.9 per cent) had the lowest employment rate, while Barrier, Ontario (68.5 per cent) had the highest.
Halifax’s employment (3 month moving average) for December 2019 was down 0.7 percent compared to the November 2019 result. The largest gain among CMAs was in Trois-Rivieres where employment was up 3.1 per cent.
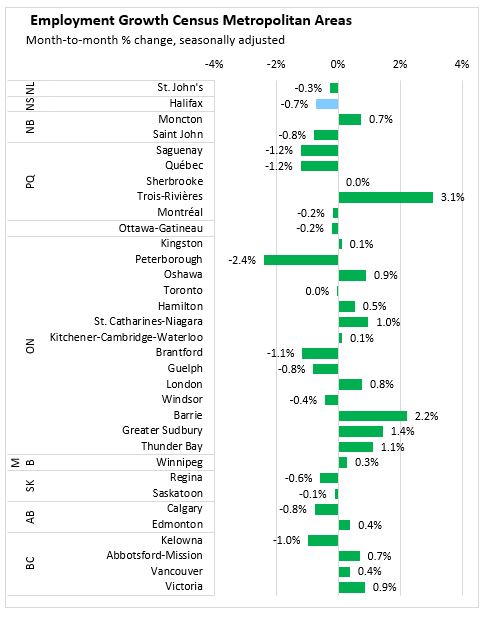
Note: Seasonally adjusted, 3 month average.
With the January 2019 Labour Force Survey release, Statistics Canada has changed the processing systems that is used to impute data of incomplete records of the survey. Statistics Canada notes that for most LFS estimates the difference from the new system will be small, but some areas could be impacted such as part-time employment and employment by firm size. The transition is being monitored and historical revisions of series maybe made in the future. For more details, see Transition of Labour Force Survey Data Processing to the Social Survey Processing Environment (SSPE)
Sources:
Statistics Canada. Table 14-10-0287-01 Labour force characteristics, monthly, seasonally adjusted and trend-cycle, last 5 months
Statistics Canada. Table 14-10-0327-01 Labour force characteristics by sex and detailed age group, annual
Statistics Canada. Table 14-10-0294-01 Labour force characteristics by census metropolitan area, three-month moving average, seasonally adjusted and unadjusted, last 5 months
Statistics Canada. Table 14-10-0096-01 Labour force characteristics by census metropolitan area, annual
Statistics Canada. Table 14-10-0293-01 Labour force characteristics by economic region, three-month moving average, unadjusted for seasonality, last 5 months
Statistics Canada. Table 14-10-0090-01 Labour force characteristics by province, territory and economic region, annual
Statistics Canada. Table 14-10-0355-01 Employment by industry, monthly, seasonally adjusted and unadjusted, and trend-cycle, last 5 months (x 1,000)
Statistics Canada. Table 14-10-0023-01 Labour force characteristics by industry, annual (x 1,000)
Statistics Canada. Table 14-10-0288-01 Employment by class of worker, monthly, seasonally adjusted and unadjusted, last 5 months (x 1,000)
Statistics Canada. Table 14-10-0027-01 Employment by class of worker, annual (x 1,000)
<--- Return to Archive