The Economics and Statistics Division maintains archives of previous publications for accountability purposes, but makes no updates to keep these documents current with the latest data revisions from Statistics Canada. As a result, information in older documents may not be accurate. Please exercise caution when referring to older documents. For the latest information and historical data, please contact the individual listed to the right.
<--- Return to Archive
For additional information relating to this article, please contact:
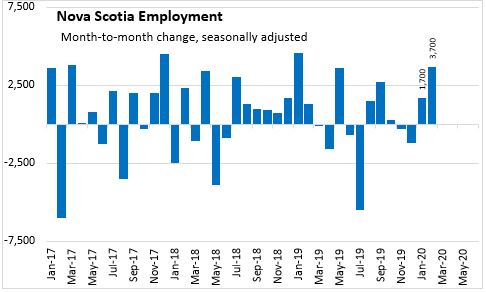
March 06, 2020LABOUR MARKET TRENDS - FEBRUARY 2020 Nova Scotia's seasonally adjusted employment level was up 3,700 in February to 471,000. Employment is 4,100 higher than it was January 2019.
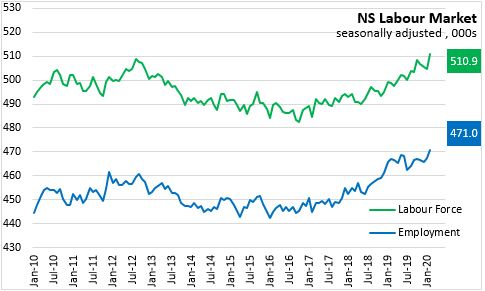
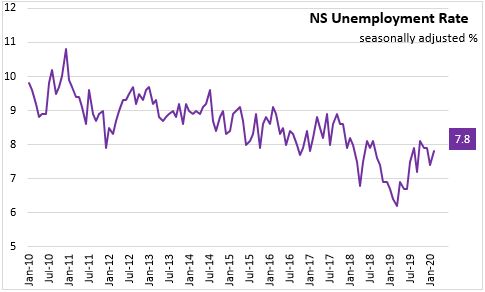
Nova Scotia's employment increase in February follows an increase of 1,700 in January after declines in both November and December. Nova Scotia’s labour force increased by 6,400 to 510,900 for February. With a smaller employment increase than the labour force increase the number of unemployed increased by 2,600 persons. The unemployment rate increased 0.4 percentage points to 7.8 per cent in February. Both employment and labour force levels in February 2020 are the highest levels ever observed in Nova Scotia.
In February, full-time employment decreased by 2,000 while part-time employment was up 5,700 persons. Note: Changes in part-time and full-time employment can include the net impacts of changing hours of work within the same position.
The year-over-year (Feb-20 vs Feb-19) increase in employment of 4,100 results from a decrease of 1,800 in full-time employment and an increase of 6,000 in part time employment. The unemployment rate was up 1.4 percentage points compared to February 2019.
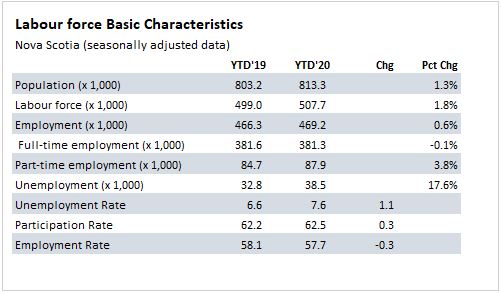
For the first two months of 2019 compared to first two months of 2018, Nova Scotia average employment has increased 0.6 per cent while the labour force has risen 1.8 per cent. The total labour force survey population estimate is up 1.3 per cent. Full-time employment was down 0.1 per cent and part-time employment increased 3.8 per cent. The larger increase in the labour force than employment lifted average unemployment rate from 6.6 per cent for Jan-Feb 2018 to 7.6 per cent for Jan-Feb 2019.
Age Cohorts
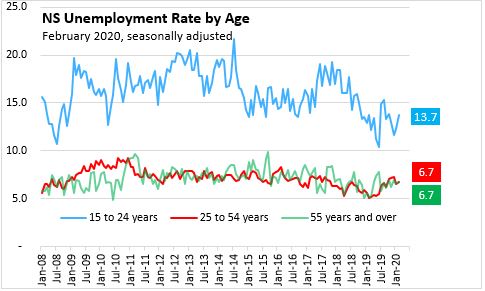
The monthly unemployment rate increased for younger workers in February, compared to January. The unemployment rate for those aged 15-24 rose 1.4 percentage points to 13.7 per cent. For those in the 25-54 year old age cohort the unemployment rate increased 0.2 percentage points to 6.7 per cent and for those aged 55 years and older the unemployment increased 0.2 percentage points to 6.7 per cent.
Age Cohort: January-February 2020 vs. January-February 2019
Comparing Jan-Feb 2020 with Jan-Feb 2019, the population in the youth cohort (aged 15-24) increased by 600 change along with an increase in both the labour force (+3,600, +4.9 per cent) and employment (+3,500, +5.4 per cent). While the number of unemployed (+300) increased among 15-24-year olds, the proportion of the youth labour force that was unemployed declined 0.3 percentage points to 13.0 per cent (compared to January-February 2019).
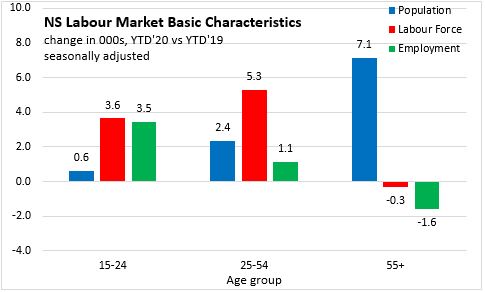
Within the 25-54 age cohort, population growth (+2,400) was less than the increase in labour force (+5,300, +1.7 per cent) but more than employment growth (+1,100, +0.4 per cent). The number of unemployed rose 4,200 and the unemployment rate was up 1.3 percentage points to 6.6 per cent on average over the first two months of last year.
For Jan-Feb 2020 compared to Jan-Feb 2019, older workers (55+) reported increases in population (+7,100), but lower labour force (-300, -0.3 per cent) and employment (-1,600, -1.5 per cent). The unemployment rate for older workers increased from 5.4 per cent to 6.6 per cent for Jan-Feb period.
Males and Females
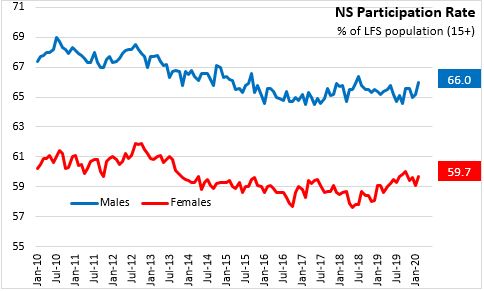
The male participation rate increased 0.8 percentage points to 66.0 per cent in February 2020. The participation rate for females was up 0.6 percentage points to 59.7 per cent compared to last month.
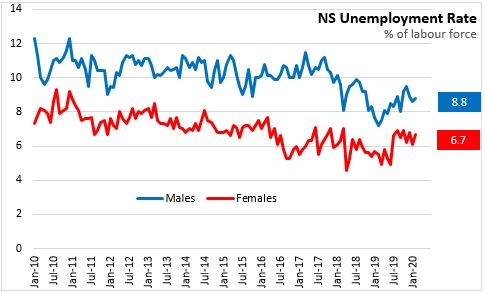
For February 2020, monthly employment increased by 2,300 among males and by 1,400 among females. The labour force was up 3,400 among males and by 2,900 among females. The stronger growth in labour force than employment increased the unemployment rate up 0.2 percentage point to 8.8 per cent for males and by 0.6 percentage point to 6.7 per cent for females.
Males and Females: January-February 2020 vs. January-February 2019
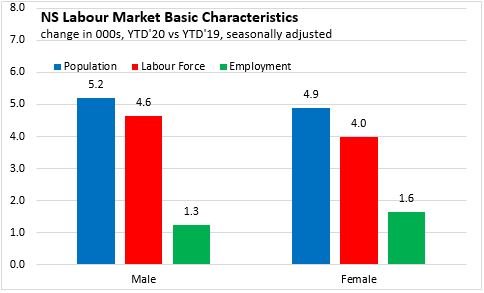
For Jan-Feb 2020 compared to Jan-Feb 2019, female labour force (+4,000, +1.6 per cent) and employment (+1,600, +0.7 per cent) were smaller than population growth (+4,900). The unemployment rate among females increased 0.8 percentage points to 6.4 per cent for Jan-Feb 2020.
For Jan-Feb 2020 compared to Jan-Feb 2019, the male population has increased by 5,200. The male labour force has increased by 4,600 (+1.8 per cent) while employment among males increased by 1,300 (+0.5 per cent). The smaller increase in employment than labour force resulted in the unemployment rate among males rising by 1.3 percentage points to 8.7 per cent for Jan-Feb 2020.
Sectors
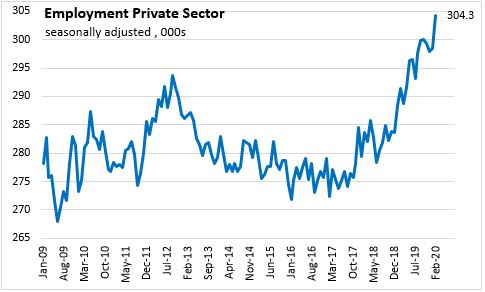
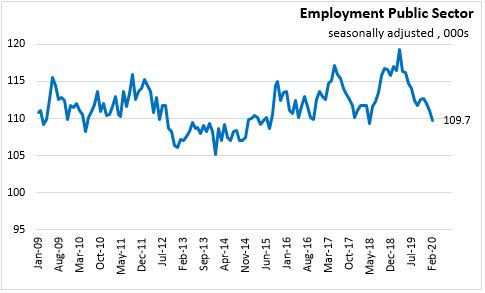
Monthly employment gains in February reflected increase in private sector employees (+5,900) and declines in public sector employees (-1,400) and in self-employed (-700). Nova Scotia’s level of private sector employment reached a new high of 304,300 in February.
Monthly employment in February was up 600 in goods industries with construction (-1,000) offset by increases in manufacturing (+800) and small increases in agriculture, forestry, fishing, and mining, and utilities.
Service sector employment increased by 3,100 in February with the largest change in information, culture, and recreation (+1,800), health care (+1,600) and professional services (+900). Largest declines for employment in February were in trade (-900) and other services (-600).

Sectors – January-February 2020 vs. January-February 2019
Looking at the results by class of worker for Jan-Feb 2020 compared to Jan-Feb 2019, employment increases for the private sector (+11,500) offset declines in public sector (-6,300) and self-employment (-2,200).
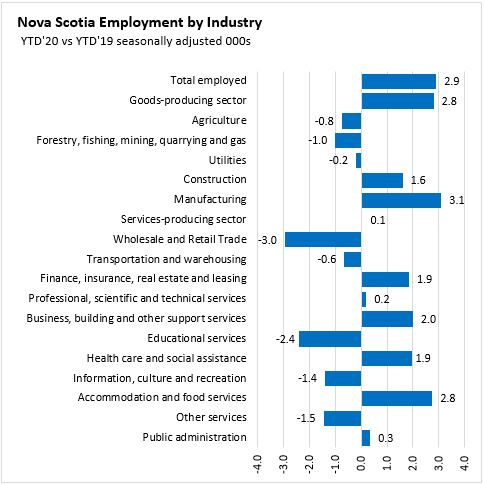
Among goods-producing sectors, compared to Jan-Feb 2019, employment increases were seen in construction (+1,600) and manufacturing (+3,100). Employment is lower in agriculture (-800), forestry, fishing, and mining (-1,000) and utilities (-200) for Jan-Feb 2020 compared to Jan-Feb 2019.
Service industry employment is nearly unchanged (+100) for Jan-Feb 2020 compared to Jan-Feb 2019. Employment declined occurred in Wholesale/retail trade (-3,000), transportation/warehousing (-600), educational services (-2,400), information, culture and recreation (-1,400), and other services (-1,500). Employment gains were seen in finance, insurance, real estate and leasing (+1,900), business, building and other support services (+2,000), health care and social assistance (+1,900) and accommodation and food services (+2,800). There were smaller changes in Professional, scientific and technical services (+200) and public administration (+300).
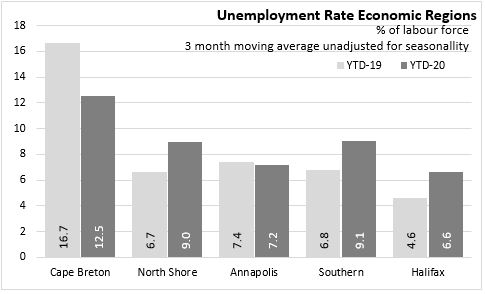
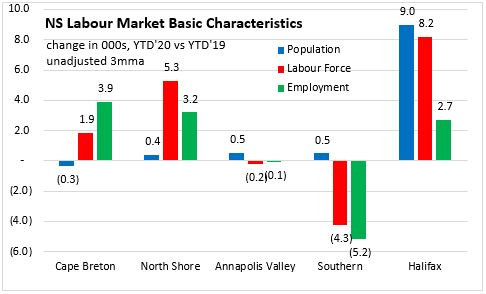
Regions – January-February 2020 vs. January-February 2019 (unadjusted 3 month moving average)
Comparing Jan-Feb 2020 Jan-Feb 2019, Cape Breton employment is up (+3,900) while the labour force increased by 1,900. The number of unemployed declined 2,100 and the unemployment rate fell 4.2 percentage points to 12.5 per cent.
For the North Shore region, the labour force increased by 5,300 while employment increased by 3,200. With labour force growing faster than employment, the number of unemployed rose by 2,100. This caused a 2.3 percentage point increase in the unemployment rate from 6.7 per cent to 9.0 per cent.
The Annapolis Valley reported a decrease of 100 in employment along with a decrease of 200 in the labour force. Unemployment declined 100 and the net result was an decrease in the unemployment rate by 0.2 percentage points to 7.2 per cent.
The Southern region had a decrease of 5,200 in employment along with a decrease of 4,300 in labour force. The unemployment rate increased 2.3 percentage points to 9.1 per cent for Jan-Feb 2020.
Halifax experienced an increase of 8.200 in labour along with an increase of 2,700 in the labour force. With unemployment rising by 5,500, there was an increase of 2.0 percentage points in the unemployment rate from 4.6 per cent to 6.6 per cent in Halifax.
Provincial Comparisons
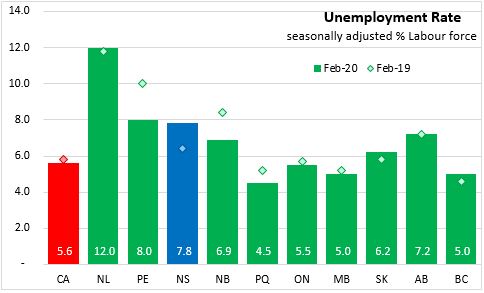
The Nova Scotia unemployment rate was 7.8 per cent in February 2020 increasing from 6.6 per cent the previous year. Canada’s unemployment rate declined 0.2 percentage points to 5.6 per cent in February 2020 compared to February 2019
Compared to February 2019, five provinces are reporting lower unemployment rates with the largest decline in Prince Edward Island where unemployment declined form 10.0 per cent to 8.0 per cent over the past year. Nova Scotia reported the largest unemployment rate increase (+1.4 percentage points) compared to February 2019.
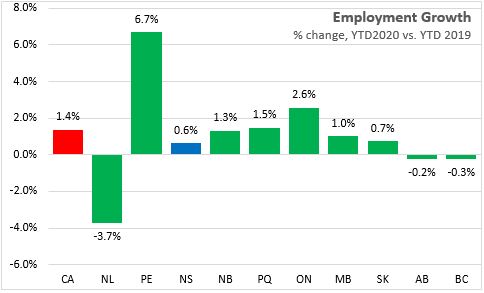
Nationally, employment rose 1.4 with gains in seven provinces over the Jan-Feb 2020 vs. Jan-Feb 2019 period. The largest gains in percentage terms was seen Prince Edward Island (+6.7%) and Newfoundland and Labrador (-3.7%) reported the largest decline.
National Comparisons: Cities (Monthly)
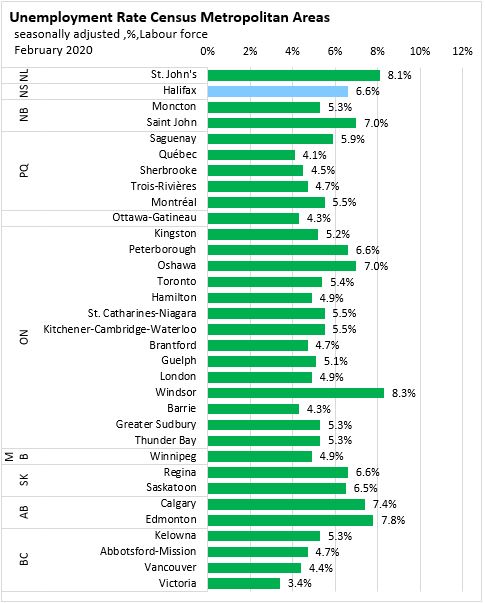
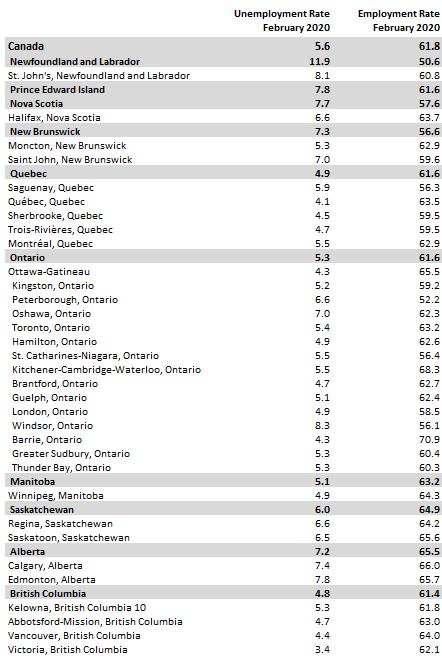
The seasonally adjusted unemployment rate for the Halifax Census Metropolitan Area (CMA) in February 2020 was 6.6 per cent (3 month moving average). Victoria, British Columbia (3.4 per cent) had the lowest unemployment rate among CMAs while the highest was in Windsor, Ontario (8.3 per cent).
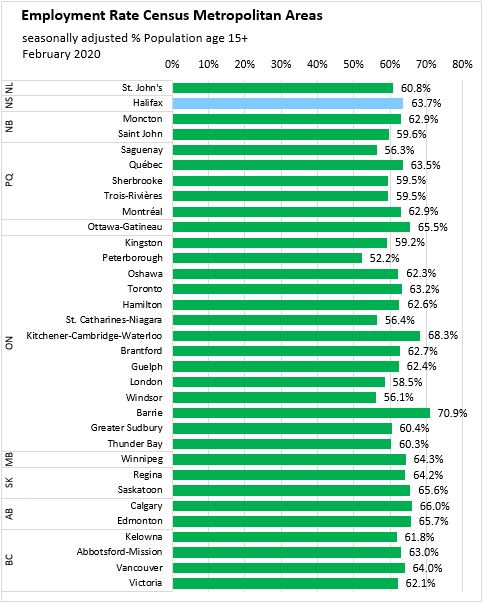
The seasonally adjusted employment rate for the Halifax was 63.7 per cent, up 0.2 percentage points compared to last month. Peterborough, Ontario (52.2 per cent) had the lowest employment rate, while Barrie, Ontario (70.9 per cent) had the highest.
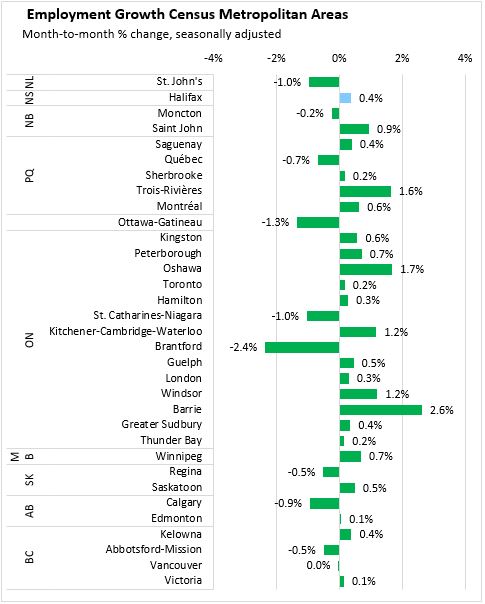
Halifax’s employment (3 month moving average) for February 2020 was up 0.4 percent compared to the January 2020 result. The largest gain among CMAs was in Barrie where employment was up 2.6 per cent.
Note: Seasonally adjusted, 3 month average.
With the January 2019 Labour Force Survey release, Statistics Canada has changed the processing systems that is used to impute data of incomplete records of the survey. Statistics Canada notes that for most LFS estimates the difference from the new system will be small, but some areas could be impacted such as part-time employment and employment by firm size. The transition is being monitored and historical revisions of series maybe made in the future. For more details, see Transition of Labour Force Survey Data Processing to the Social Survey Processing Environment (SSPE)
Sources:
Statistics Canada. Table 14-10-0287-01 Labour force characteristics, monthly, seasonally adjusted and trend-cycle, last 5 months
Statistics Canada. Table 14-10-0294-01 Labour force characteristics by census metropolitan area, three-month moving average, seasonally adjusted and unadjusted, last 5 months
Statistics Canada. Table 14-10-0293-01 Labour force characteristics by economic region, three-month moving average, unadjusted for seasonality, last 5 months
Statistics Canada. Table 14-10-0355-01 Employment by industry, monthly, seasonally adjusted and unadjusted, and trend-cycle, last 5 months (x 1,000)
Statistics Canada. Table 14-10-0288-01 Employment by class of worker, monthly, seasonally adjusted and unadjusted, last 5 months (x 1,000)
<--- Return to Archive