The Economics and Statistics Division maintains archives of previous publications for accountability purposes, but makes no updates to keep these documents current with the latest data revisions from Statistics Canada. As a result, information in older documents may not be accurate. Please exercise caution when referring to older documents. For the latest information and historical data, please contact the individual listed to the right.
<--- Return to Archive
For additional information relating to this article, please contact:
May 08, 2020LABOUR MARKET TRENDS - APRIL 2020 Nova Scotia’s labour force survey results reflect the period from April 12-18, when restrictions to manage COVID-19 were generally fully in place
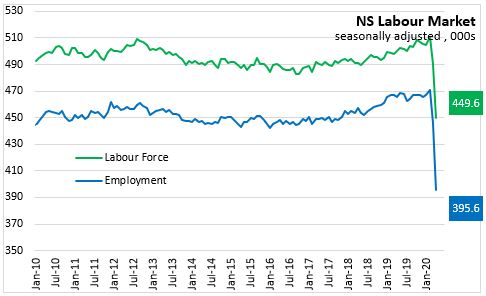
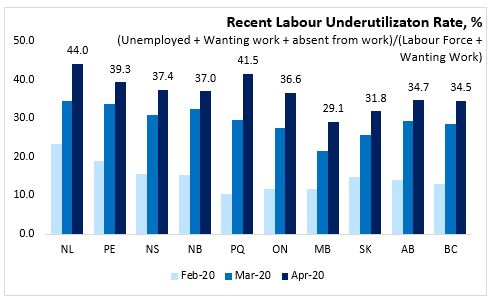
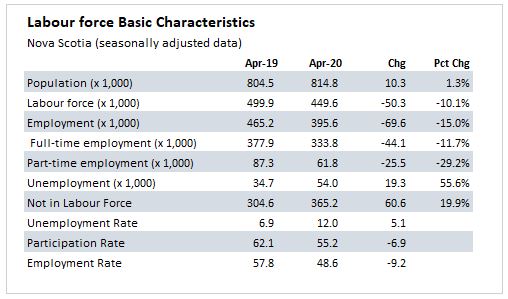
Nova Scotia's seasonally adjusted employment level was down 50,600 (-11.3%) in April following on the 24,800 employment decline in March. Employment in April 2020 was 395,600, a level last seen in 1998. Nova Scotia’s employment has declined by 75,400 (-16.0%) since February 2020 as the COIVD-19 pandemic and public health measures to contain it had a severe impact on the labour market.
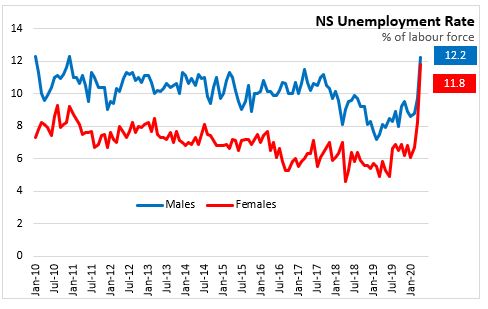
Nova Scotia’s labour force decreased by 40,600 (-8.3%) to 449,600 for April, following on the decline of 20,700 in March. The labour force in April 2020 is smaller by 61,300 (-12.0%) than February 2020. The number of unemployed was up 9,900 in April following on 4,300 in March. The unemployment rate increased 3.0 percentage points to 12.0 per cent in April. This is Nova Scotia’s highest unemployment rate since June 1997.
The population not in labour force rose 41,100 compared to last month after an increase of 21,400 in March. Compared to February 2020, are an additional 62,500 persons not in the labour force and 14,200 unemployed.


In April, full-time employment decreased by 38,800 (-10.4%) while part-time employment was down 11,800 (-16.0%). Employment losses since February 2020 have been 46,500 full-time employment and 28,900 part-time employment.
With the population mostly steady (+0.1%) in April 2020, the participation rate declined 5.0 percentage points after a 2.6 percentage points decline last month to 55.2 per cent with the large exit from labour market. This is the lowest participation rate since 1977. The employment rate declined 6.2 percentage points to 48.6 per cent in April 2020, the lowest on records back to January 1976.
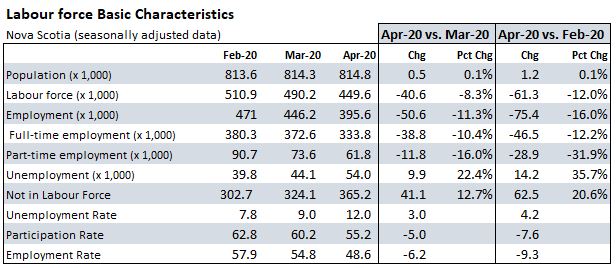
In addition to those who have lost employment since February 2020, Statistics Canada also identified that there are a further 53,300 who are still counted as employed, but had zero hours (and not for routine reasons like vacation, maternity/parental leave, labour dispute) or had their hours cut by 50 per cent or more. Combined with those who have lost their employment, this amounts to about 26.7 per cent of Nova Scotia’s February 2020 employment level. The largest total employment impact has been in Quebec at 34.5 per cent of February employment level, the smallest change has been in Saskatchewan (19.9%).
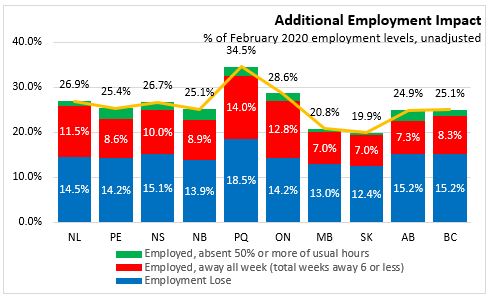
Statistics Canada reported in supplemental information that Nova Scotia had an increase of 39,800 (Feb20 to Apr20) of those who were not in the labour force but wanted to work. The recent labour underutilization rate is the proportion of the labour force plus those wanting work but not in labour force that are either not employed or absent from work. The rate has risen in every province since February. Nova Scotia in February 2020 has recent labour underutilization rate of 15.5 which has risen to 37.4 per cent in April 2020. The largest increase in the rate was in Quebec where it has risen form 10.3 per cent to 41.5 per cent. The lowest recent labour underutilization rate is in Manitoba at 29.1 per cent.
Compared to April 2019, Nova Scotia’s labour force has declined by 50,300 (-10.1%) and employment is lower by 69,600 (-15.0%). The number of unemployment has risen 19,300 and the not in Labour Force is up 60,600.
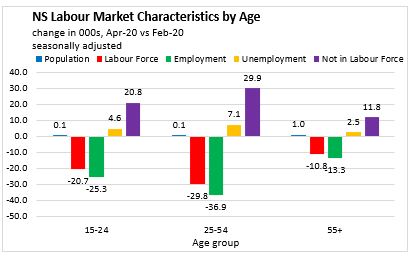
Age Cohorts
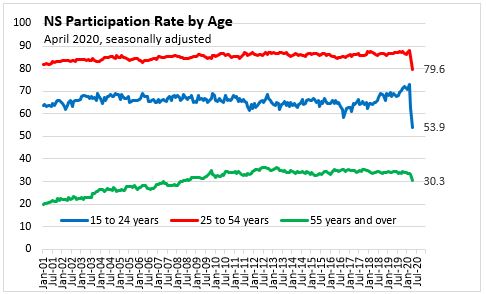
The monthly decline in participation rate of 5.0 per cent was observed across all age groups, but more for younger workers. Between March and April, the participation rate of younger Nova Scotians (15-24), declined 8.7 percentage points to 53.9 per cent. For core aged Nova Scotians (25-54) the participation rate declined 5.9 percentage points to 79.6 per cent, and for older workers the participation rate declined 3.0 percentage points to 30.3 per cent.
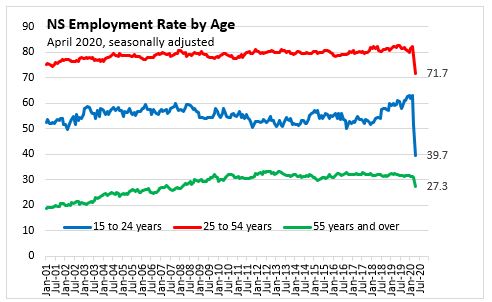
Employment rates were down 12.1 percentage points for youth, 7.2 percentage points for core-aged workers, and 3.5 percentage points for older workers in April 2020.
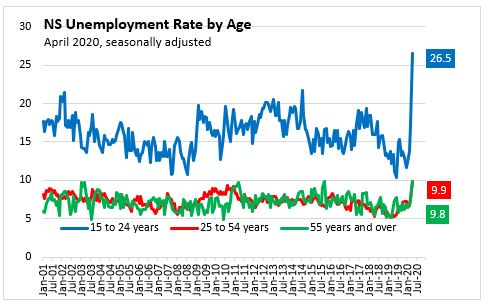
The unemployment rate rose 9.3 percentage points for youth to 26.5 per cent. The unemployment rate for core aged workers was up 2.2 percentage points to 9.9 per cent while the unemployment rate for older workers was up 2.3 percentage points to 9.8 per cent.
Comparing April 2020 to March 2020, the decline in employment mostly shows up in persons not the labour force rather than unemployment for all age groups.
Age Cohort: April 2020 vs. April 2019
Comparing April 2020 with April 2019, the population in the youth cohort (aged 15-24) increased 800 while labour force (-15,900) and employment (-21,300) both declined. While the number of unemployed (5,400) increased among 15-24-year olds, the youth unemployment rate rose 13.1 percentage points to 26.5 per cent for April 2020.
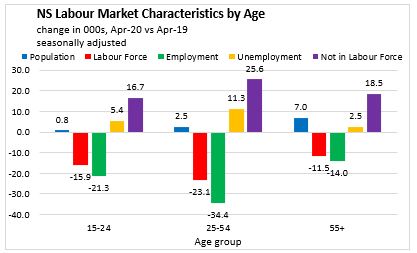
Within the 25-54 age cohort, the population grew (+2,500) from April 2019 to April 2020 while both labour force (-23,100, -7.5 per cent) and employment (-34,400, -11.8 per cent) declined. Compared to April 2019, The number of unemployed in core working ages rose 11,400 and the unemployment rate was up 4.5 percentage points to 9.9 per cent. The number of persons not in the labour force increased 25,600.
For April 2020 compared to April 2019, older workers (55+) reported increases in population (+7,000), but lower labour force (-11,500, -9.9 per cent) and employment (-14,000, -12.9 per cent). The unemployment rate for older workers increased from 6.7 per cent to 9.8 per cent for April 2020.
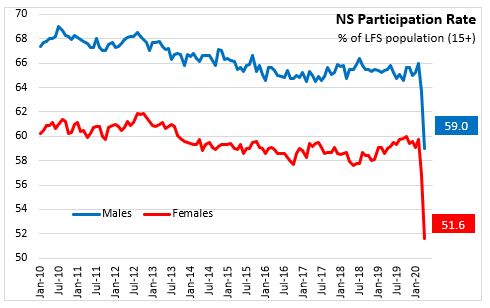
Males and Females
For April 2020, the monthly participation rate declined by 4.7 percentage points among Males to 59.0 per cent and by 5.3 percentage points among Females to 51.6 per cent.
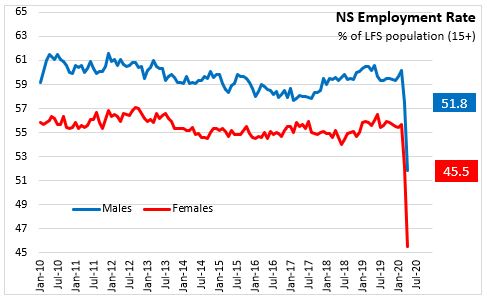
The employment Rate declined by 5.7 percentage points for Males in April and by 6.7 percentage points for Females.
The monthly unemployment rate was up by 2.5 percentage points among Males to 12.2 per cent and up by 3.6 percentage points to 11.8 per cent for Females.
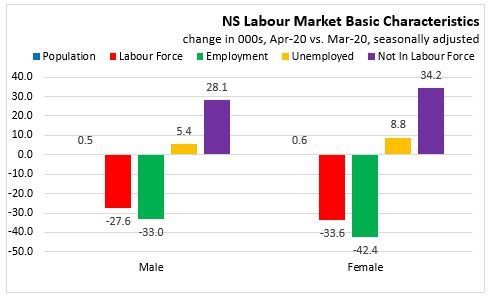
Compared with February 2020, male labour force is down 27,600 (-10.6 per cent) while female labour force is down 33,600 (-13.9 per cent). Male employment is down 33,000 (-13.9 per cent) while female employment is down 42,400 (-18.2 per cent). The number of unemployed is up 5,400 for males and 8,800 for females. The male population not in the labour force increased by 28,100 (+21.0 per cent) while the number of females not in the labour force grew by 34,200 (+20.3 per cent).
Males and Females: April 2020 vs. April 2019
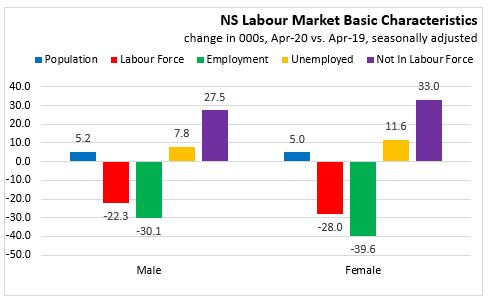
For April 2020 compared to April 2019, there were declines in female labour force (-28,000, -11.4 per cent) and employment (-39,600, -17.2 per cent). The unemployment rate among females increased 6.0 percentage points to 11.8 per cent for April 2020. Compared to April 2019, there are an additional 33,000 females not in the labour force.
For April 2020 compared to April 2019, the male labour force has decreased by 22,300 (-8.7 per cent) while employment among males decreased by 30,100 (-12.8 per cent). The larger decrease in employment than labour force resulted in the unemployment rate among males rising by 4.1 percentage points to 12.2 per cent for April 2020.
Sectors and Industries
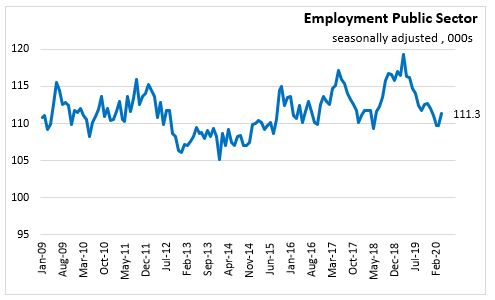
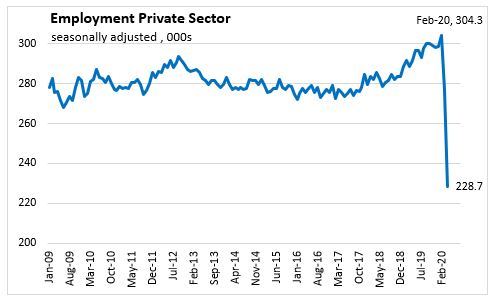
Monthly employment declines in April were mostly in the private sector (-48,500) with self-employment (-3,800) and public sector employment (+1,600) seeing smaller changes. Since February 2020, the total employment decline of 75,400 has been in private sector employees (-75,600) and self employment (-1,600) while public sector employees have risen 1,600. (Totals do not add due to rounding).
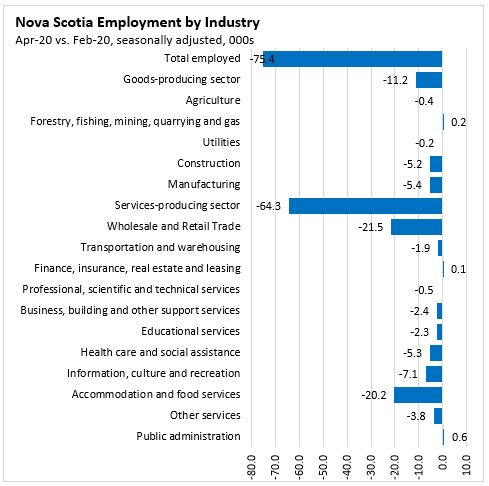
For April 2020, monthly employment declined in every industry except Agriculture (+100) and forestry, fishing, mining, quarrying and oil and gas (+100). Service-producing industries’ employment declined 41,100 (-11.5%) and goods-producing industries’ employment was down 9,500. (-10.8%).

Employment since February 2020 has decreased 11,200 in goods-producing industries with employment losses in construction (-5,200) and manufacturing (-5,400), mostly occurring between March and April. Service-producing employment declined 64,300 since February 2020 with the largest declines in wholesale and retail trade (-21,500) and accommodation and food service (-20,200) and information, culture and recreation (-7,100). Employment declines also have been observed in health care and social assistance (-5,300 including child care services), other services (-3,800 including personal services such as hair care), business, building and other support services (-2,400 including call centres), educational services (-2,300), and transportation and warehousing (-1,900).

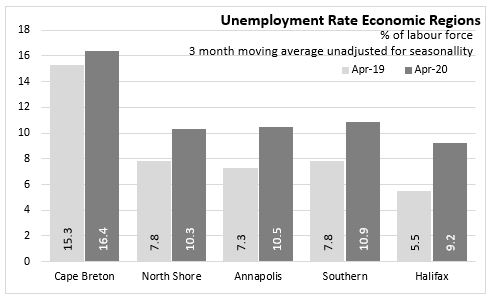
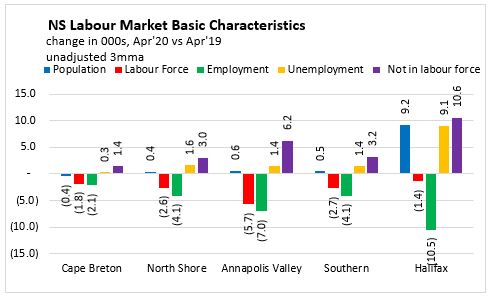
Regions – April 2020 vs. April 2019 (unadjusted 3 month moving average)
Comparing April 2020 with April 2019, Cape Breton employment is down (-2,100) while the labour force decreased by 1,800. The number of unemployed increased 300 and the unemployment rate rose 1.1 percentage points to 16.4 per cent.
For the North Shore region, the labour force decreased by 2,600 while employment decreased by 4,100. With labour force growing declining less than employment the number of unemployed rose by 1,600. This caused a 2.5 percentage point increase in the unemployment rate from 7.8 per cent to 10.3 per cent.
The Annapolis Valley reported a decrease of 5,700 in labour force and employment falling 7,000. Unemployment was up 1,400 and the net result was an increase in the unemployment rate by 3.2 percentage points to 10.5 per cent. There are 6,200 more persons not in the labour force in Annapolis Valley compared to last year.
The Southern region had a decrease of 4,100 in employment along with a decrease of 2,700 in the labour force. The unemployment rate increased 3.1 percentage points to 10.9 per cent for April 2020.
Halifax experienced an decrease of 1,400 in the labour force along with an decrease of 10,500 in employment. With unemployment rising by 9,100, there was an increase of 3.7 percentage points in the unemployment rate from 5.5 per cent to 9.2 per cent in Halifax. The number of persons not in the labour force increased 10,600 in Halifax compared to last year.
Provincial Comparisons
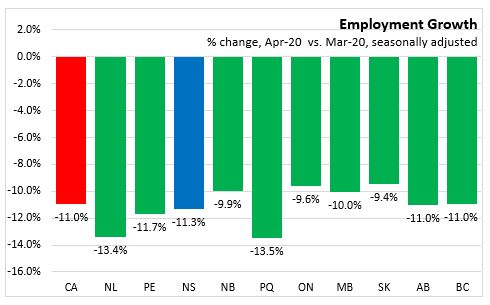
All provinces report declines in employment and labour force compared to March. The largest employment declines were in Quebec (-13.5%) and Newfoundland and Labrador (-13.4%). The smallest employment declines were in Saskatchewan (-9.4%) and Ontario (-9.6%).
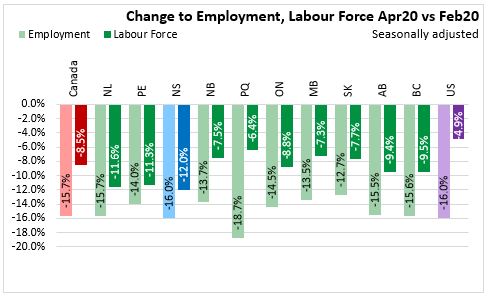
Compared to February 2020, labour force and employment are down in all provinces and the United States. The largest employment decline since February was in Quebec (-18.7%) and the smallest decline has been in New Brunswick (-13.7%).
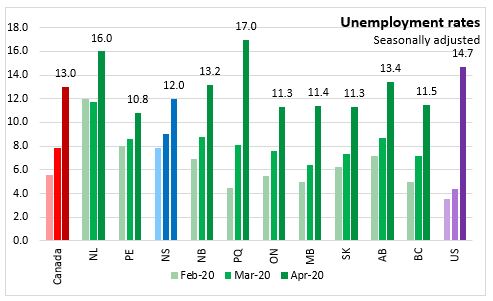
Unemployment rates climbed again in April 2020 after rising in March 2020. The highest unemployment rate for April 2020 is in Quebec at 17.0 per cent and the lowest is in Prince Edward Island at 10.8 per cent. Canada’s unemployment rate was 13.0 per cent in April 2020.
National Comparisons: Cities (Monthly)
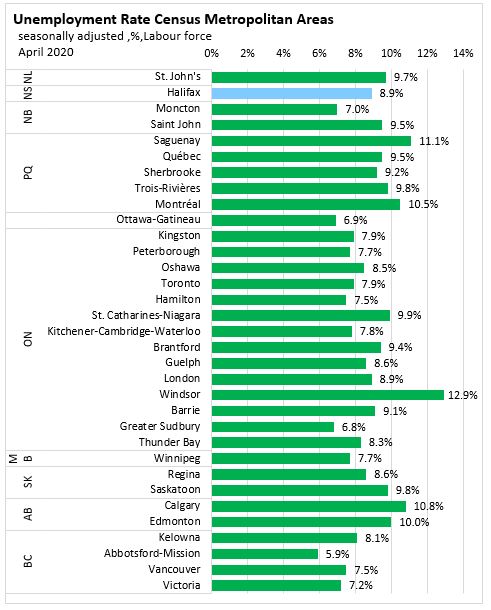
The seasonally adjusted unemployment rate for the Halifax Census Metropolitan Area (CMA) in April 2020 was 8.9 per cent (3 month moving average). Abbotsford-Mission at 5.9 per cent had the lowest unemployment rate among CMAs while the highest was in Windsor, Ontario (12.9 per cent).
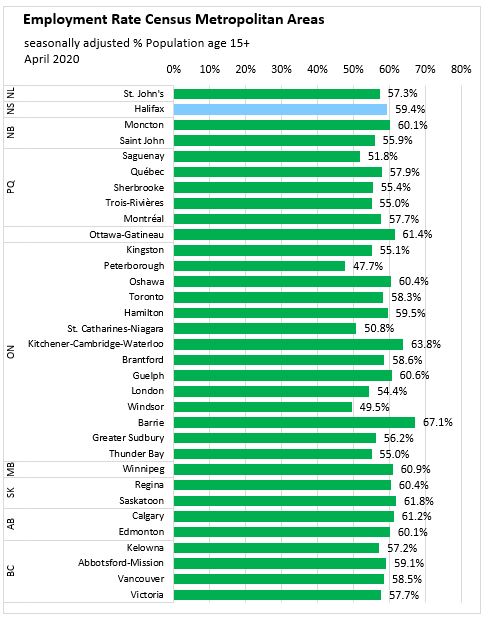
The seasonally adjusted employment rate for the Halifax was 59.4 per cent, down 3.4 percentage points compared to last month. Peterborough, Ontario (47.7 per cent) had the lowest employment rate, while Barrie, Ontario (67.1 per cent) had the highest.
Halifax’s employment (3 month moving average) for April 2020 was down 5.2 percent compared to the March 2020 result. All CMAs except Guelph reported lower employment in April. The largest declines in CMA employment was in Windsor (-8.3%) and the smallest decrease was in Oshawa (-2.5%).


Note: Seasonally adjusted, 3 month average.
Sources:
Statistics Canada. Table 14-10-0287-01 Labour force characteristics, monthly, seasonally adjusted and trend-cycle, last 5 months
Statistics Canada. Table 14-10-0294-01 Labour force characteristics by census metropolitan area, three-month moving average, seasonally adjusted and unadjusted, last 5 months
Statistics Canada. Table 14-10-0293-01 Labour force characteristics by economic region, three-month moving average, unadjusted for seasonality, last 5 months
Statistics Canada. Table 14-10-0355-01 Employment by industry, monthly, seasonally adjusted and unadjusted, and trend-cycle, last 5 months (x 1,000)
Statistics Canada. Table 14-10-0288-01 Employment by class of worker, monthly, seasonally adjusted and unadjusted, last 5 months (x 1,000)
<--- Return to Archive