The Economics and Statistics Division maintains archives of previous publications for accountability purposes, but makes no updates to keep these documents current with the latest data revisions from Statistics Canada. As a result, information in older documents may not be accurate. Please exercise caution when referring to older documents. For the latest information and historical data, please contact the individual listed to the right.
<--- Return to Archive
For additional information relating to this article, please contact:
May 21, 2020NEW HOUSING PRICE INDEX, APRIL 2020 APRIL 2020
Statistics Canada noted that 16 of the 27 census metropolitan areas (CMAs) included in the survey saw little or no change in new housing prices in April 2020 compared to the previous month. However, the number of new homes sold by the builders surveyed in April declined by almost two-thirds (64.1%) compared with the same month last year. A similar trend was observed on the resale market at the national level, with sales down 57.6% in April year over year, according to the Canadian Real Estate Association.
The slowdown in new sales activity occurred as physical distancing policies were put in place to curb the spread of COVID-19. Although real estate services continued to be offered, there were new challenges in viewing and selling homes as builders and buyers, adjusted to the new normal of selling and buying home.
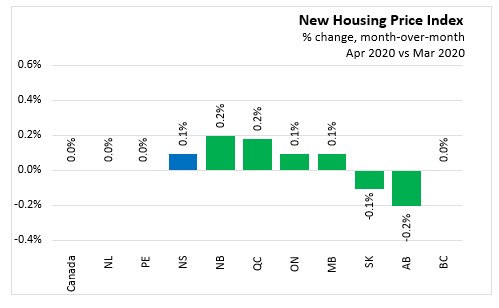
In April 2020, the price of new housing was up 0.1 per cent in Nova Scotia compared to the previous month, while the national index stayed flat following two consecutive monthly increases.

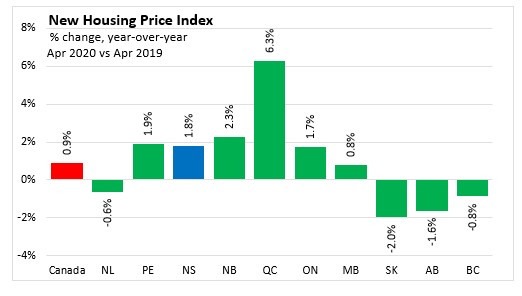
Year-over-Year (April 2020 vs. April 2019)
In April, Nova Scotia's new housing prices were 1.8 per cent higher than they were in April 2019.
National new housing prices increased 0.9 per cent year over year in April. Quebec saw the fastest growth in new housing prices at 6.3 per cent. New housing prices were lower in Saskatchewan, Alberta, British Columbia, and Newfoundland and Labrador.
Census Metropolitan Areas
Year over year new house price growth among Census Metropolitan Areas was fastest in Ottawa (+10.5%), Montreal (+8.4%), and Kitchener-Cambridge-Waterloo (+5.4%). New housing prices declined the most in Regina (-3.6%), Calgary (-1.6%), Edmonton (-1.5%), and Vancouver (-1.2%).
New housing prices were down in all CMAs in Saskatchewan and Alberta. New housing price index also declined in St. John's (-0.6%), and Toronto (-0.1%).

Statistics Canada Note: With the release of the January 2017 NHPI data, a number of important changes have been introduced to increase the relevance of the index series. The index base period, for which the NHPI equals 100, is now December 2016. The NHPI basket has been updated with new weights for the 2017 series, its coverage has been expanded to include new CMAs.
Source Statistics Canada. Table 18-10-0205-01 New housing price index, monthly
<--- Return to Archive