The Economics and Statistics Division maintains archives of previous publications for accountability purposes, but makes no updates to keep these documents current with the latest data revisions from Statistics Canada. As a result, information in older documents may not be accurate. Please exercise caution when referring to older documents. For the latest information and historical data, please contact the individual listed to the right.
<--- Return to Archive
For additional information relating to this article, please contact:
June 01, 2020PROVINCIAL GDP BY INDUSTRY 2019 [PRELIMINARY] Statistics Canada released preliminary estimates of real GDP by industry for the provinces and territories in 2019.
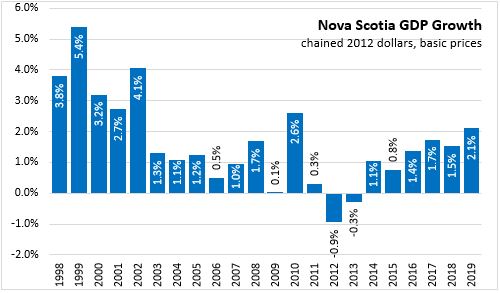
Real GDP growth is measured at the industry level with chained 2012 dollars at basic prices (sellers' prices before taxes less subsidies on products) that removes the effect of price changes. In 2019, Nova Scotia real GDP grew 2.1 per cent, the sixth consecutive year of growth and the fastest growth since 2010.
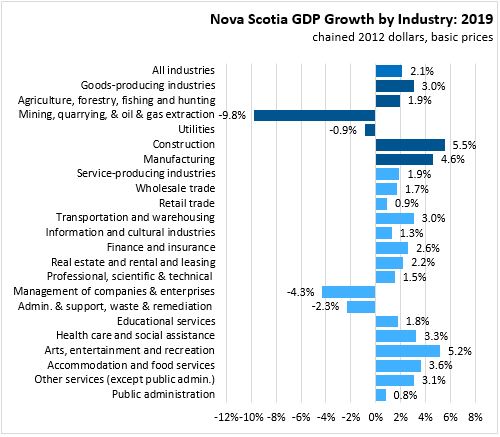
The goods-producing sector expanded by 3.0 per cent while the service-producing industries grew by 1.9 per cent in 2019.

In goods producing industries, real GDP was up in construction, manufacturing and fishing, partially offset by declines in oil/gas, mining/quarrying, utilities, agriculture and forestry.
- Agriculture real GDP declined -1.0 per cent in 2019 with reductions in crop production (-0.7 per cent), cannabis (-2.6 per cent reflecting an increase in licensed production offset by a decline in unlicensed production), aquaculture (-0.6 per cent) and animal production (-0.9 per cent)
- Real GDP from forestry/logging (not including processing industries) was down 1.9 per cent in 2019.
- Fishing real GDP increased by 3.6 per cent in 2019.
- Output in mining/quarrying/oil/gas was down -9.8 per cent as natural gas output ceased (-100 per cent). There were also declines in real GDP from gold mining (-4.3 per cent) and non-metallic mining/quarrying (-4.0 per cent). Real GDP increased in coal mining (+50.6 per cent).
- Utility real GDP was down (-0.9 per cent) on lower electricity output (-1.4 per cent)
- Construction real GDP was up 5.5 per cent with stronger gains in residential construction (+11.2 per cent) as well as engineering construction (+5.4 per cent). Real GDP was down in non-residential building construction (-1.7 per cent) and repair construction (-0.2 per cent).
- Manufacturing real GDP increased by 4.6 per cent with gains in seafood processing (+6.7 per cent), bakeries/other food manufacturing (+9.8 per cent), beverages (+5.4 per cent), converted paper (+3.7 per cent), plastics (+4.7 per cent), non-metallic mineral products (+9.8 per cent), machinery (+14.4 per cent), computers/electronics (+16.2 per cent) and electrical equipment (+19.7 per cent). Transportation equipment real GDP was up 12.5 per cent as a gain in ship/boat building GDP (+25.8 per cent) offset a decline in aerospace/parts (-1.9 per cent). Real GDP from rubber product manufacturing was down (-0.5 per cent) as was real GDP from fabricated metals (-0.3 per cent). Manufacturing real GDP was down for pulp/paper (-6.9 per cent) but up for wood products (+0.2 per cent).
Service-producing industries GDP grew by 1.9 per cent in 2019.
- Wholesale (1.7 per cent) and retail trade (1.9 per cent) had faster growth than in 2018.
- Transportation and warehousing real GDP was up 3.0 per cent on growth in water transportation (+4.6 per cent), truck transportation (+3.9 per cent), couriers (+8.0 per cent) and warehousing (+6.4 per cent). Real GDP was down in air (-0.3 per cent) and rail transportation (-3.3 per cent) as well as postal services (-3.7 per cent).
- Information/cultural industry real GDP was up 1.3 per cent, largely on gains in telecommunications (+2.0 per cent) which accounts for most of information/cultural industry GDP.
- Real GDP in finance/insurance increased by 2.6 per cent in 2019 on gains in banking/credit unions (+3.5 per cent) and a 1.8 per cent rise in real GDP for insurance.
- Real estate/rentals/leasing real GDP increased by 2.2 per cent, including a 2.4 per cent increase in the imputed real GDP generated by owner-occupied dwellings. Outside of this real GDP was also up notably for non-automotive rental and leasing services (+5.2 per cent), real estate agents (+10.1 per cent) while there was a smaller increase for lessors of real estate (+0.2 per cent).
- Real GDP in professional/scientific/technical services was up 1.5 per cent as larger gains in architectural/engineering services (+9.0 per cent), scientific research/development (+17.8 per cent) and specialized design (+24.4 per cent) offset real GDP declines in other sub-industries, including legal (-1.9 per cent), accounting (-2.7 per cent), management consulting (-1.0 per cent), computer systems design (-3.3 per cent) and advertising/public relations (-8.4 per cent).
- Real GDP generated by management of companies declined by 4.3 per cent.
- Administrative/support service and waste remediation real GDP was down 2.3 per cent in 2019 with declines in employment services (-7.3 per cent), business support services (-9.0 per cent, including call centres), travel arrangement (-17.9 per cent) and waste management (-4.1 per cent). These were partially offset by increases in building services (+3.6 per cent) and investigation/security services (+7.5 per cent).
- Educational industries' real GDP increased 1.8 per cent on gains in all sub-industries: universities (+1.4 per cent), primary/secondary (+1.6 per cent), colleges (+2.1 per cent) and other educational services (+7.4 per cent).
- Health care and social assistance real GDP was up 3.3 per cent due to rising output in health care (+3.0 per cent, including offices of doctors/dentists, hospitals and nursing/residential care) and social assistance (+6.8 per cent, including child care as well as child/family services, food banks and community-based emergency services)
- Real GDP in Arts/entertainment/recreation industries was up 5.2 per cent with gains in amusement/recreation services (+9.6 per cent) and performing arts/sports/heritage institutions (+2.3 per cent) offsetting a decline in real GDP from gambling industries (-3.1 per cent)
- Accommodation/food service real GDP grew by 3.6 per cent in 2019 including a 6.7 per cent rise in accommodation services and a 2.4 per cent increase in food service and drinking places.
- Real GDP in other services outside public administration was up 3.1 per cent including 2.4 per cent in repair/maintenance, 5.0 per cent in personal care services and 5.2 per cent in professional/civic/grant making institutions.
- Public administration real GDP (excluding health care and educational services) increased 0.8 per cent with real GDP rising faster in aboriginal public administration (+5.5 per cent) and local government (+1.4 per cent) than in provincial (+0.5 per cent), military (+0.6 per cent) or federal government services (+0.3 per cent).
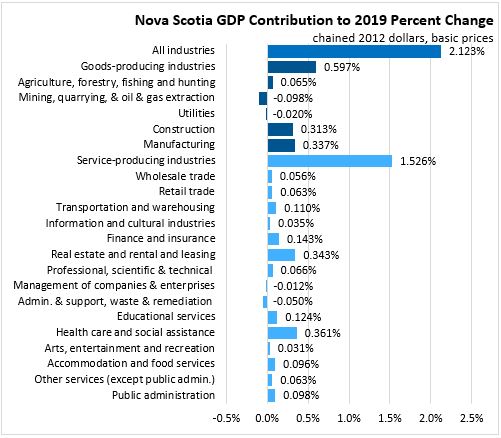
Most of Nova Scotia's increase in real GDP in 2019 is actually attributable to growth in health care, real estate, construction and manufacturing, though there were positive contributions across most industries.
National real GDP at basic prices was up 1.7 per cent in 2019. All provinces except Alberta and Saskatchewan reported positive economic growth. The fastest growth occurred in Prince Edward Island (4.5 per cent), followed by Newfoundland and Labrador +4.0 per cent).

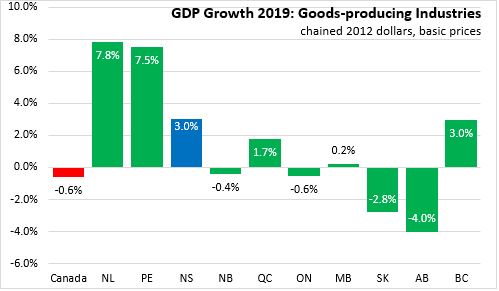
Goods industry real GDP declined 0.6 per cent in Canada in 2019. Output was notably down in Alberta, Saskatchewan, Ontario and New Brunswick. The fastest growth in goods industry real GDP was in Newfoundland and Labrador as well as Prince Edward Island.
Service industry growth was 2.5 per cent for Canada in 2019. There was real GDP growth for service industries in each province with faster growth in Prince Edward Island and Quebec. Service industry growth was slower in Saskatchewan and Newfoundland and Labrador.

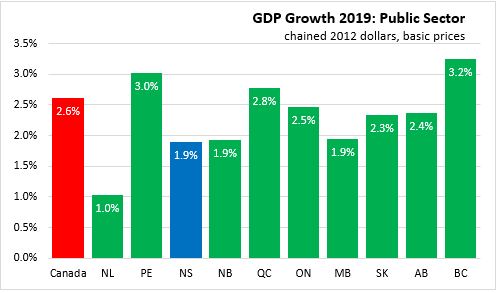
Public sector GDP (which is included in service industries) was positive for Canada (+2.6 per cent) and all provinces. Public sector real GDP grew more quickly in British Columbia and Prince Edward Island. Public sector growth was slower in Newfoundland and Labrador.
Source: Statistics Canada. Table 36-10-0402-01 Gross domestic product (GDP) at basic prices, by industry, provinces and territories (x 1,000,000)
<--- Return to Archive