The Economics and Statistics Division maintains archives of previous publications for accountability purposes, but makes no updates to keep these documents current with the latest data revisions from Statistics Canada. As a result, information in older documents may not be accurate. Please exercise caution when referring to older documents. For the latest information and historical data, please contact the individual listed to the right.
<--- Return to Archive
For additional information relating to this article, please contact:
June 12, 2020CANADA INDUSTRIAL PRODUCT PRICES, MAY 2020 (FLASH) During the COVID-19 pandemic, comparisons of year-to-date averages and sums do not show Nova Scotia’s rapidly changing economic situation. The DailyStats will focus on year-over-year comparisons, comparing one month with the same month in the prior year. Where possible the DailyStats will make comparisons of seasonally adjusted data from the pre-COVID-19 period (January and February 2020) with the period during which COVID-19 measures were in place from March 2020 onwards.
Overall Canadian industrial product prices increased 1.2% from May 2020 vs Apr 2020, and are down 1.0% from May 2020 vs Mar 2020 and are down 2.5% over May 2020 vs Feb 2020. Excluding energy and petroleum products, industrial product prices are up 0.8% from May 2020 vs Apr 2020, and are up 0.8% from May 2020 vs Mar 2020 and are up 1.9% from May 2020 vs Feb 2020.
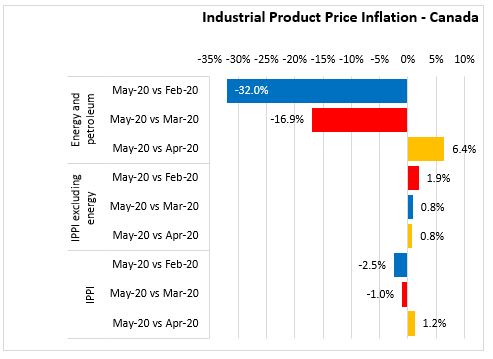
Declining industrial products are largely attributable to reductions in the prices of energy and petroleum products, which are up 6.4% from May 2020 vs Apr 2020, and are down 16.9% from May 2020 vs Mar 2020 and are down 32.0% from May 2020 vs Feb 2019.
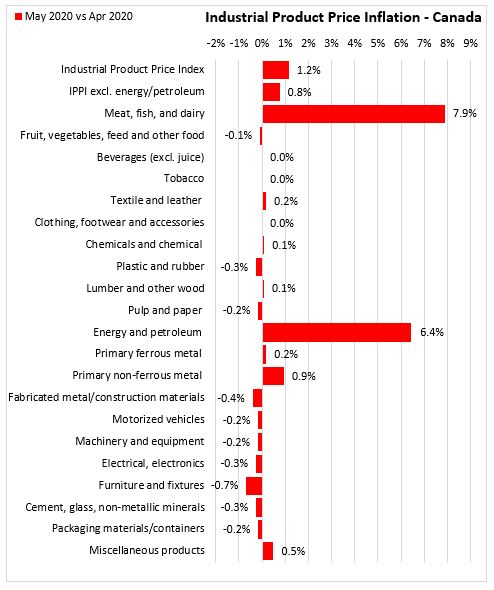
Month-over-month prices for the majority of non-energy industrial products (11 of 21) were up or unchanged from May 2020 vs Apr 2020. In May 2020 vs Feb 2020, most non-energy industrial product prices (18 of 21) are up with the exceptions of chemicals/chemical products and Furniture and fixtures. The fastest price growth was observed for meat/fish/dairy products .
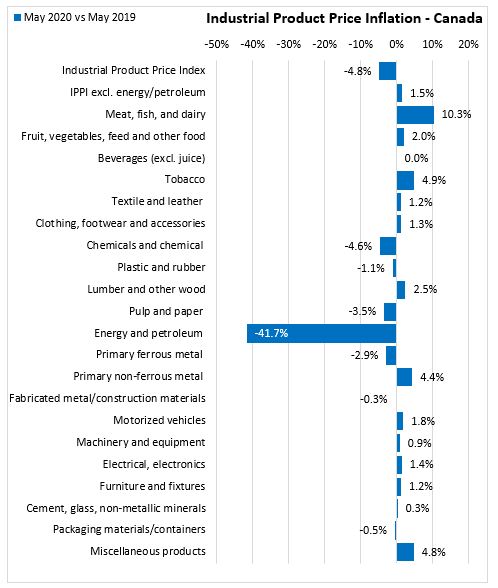
Year-over-year (May 2020 vs May 2019), most non-energy industrial product prices are (14 of 21) up with the exceptions of
- Chemicals and chemical and Plastic and rubber
- Pulp and paper
- Primary ferrous metal
- Fabricated metal/construction materials and
- Packaging materials/containers
Source: Industrial Product Price Index: Flash estimates, May 2020
Source: Industrial Product Price Index: Flash estimates, April 2020
<--- Return to Archive