The Economics and Statistics Division maintains archives of previous publications for accountability purposes, but makes no updates to keep these documents current with the latest data revisions from Statistics Canada. As a result, information in older documents may not be accurate. Please exercise caution when referring to older documents. For the latest information and historical data, please contact the individual listed to the right.
<--- Return to Archive
For additional information relating to this article, please contact:
June 15, 2020MANUFACTURING SHIPMENTS, APRIL 2020 During the COVID-19 pandemic, comparisons of year-to-date averages and sums do not show Nova Scotia’s rapidly changing economic situation. The DailyStats will focus on year-over-year comparisons, comparing one month with the same month in the prior year. Where possible the DailyStats will make comparisons of seasonally adjusted data from the pre-COVID-19 period (January and February 2020) with the period during which COVID-19 measures were in place from March 2020 onwards.
COVID-19 DAMPENS SALES
"In April 2020, over four-fifths (85.2%) of establishments in the manufacturing sector reported that their activities were impacted by COVID-19. Industries reported operating at limited capacity or ceased operations completely in response to lower global demand or to comply with physical distancing measures.
- Manufacturers in the printing and related product (95.6%),
- furniture and related product (93.7%),
- transportation equipment (93.7%),
- textile mills (92.0%),
- computer and electronic product (91.6%) and
- clothing (91.0%)" Statistics Canada

In Nova Scotia April 2020, seasonally adjusted Manufacturing Shipments decreased 8.7% to $682.1 million over March 2020 and decreased 8.5% over April 2019. Seasonally adjusted non-durable shipments have risen from $405.2 million in January 2015 to $439.3 million in April 2020. Durable shipments have increased from $191.9 million in January 2015 to $242.9 million in April 2020.
In Canada April 2020, seasonally adjusted Manufacturing Shipments decreased 28.5% to $36.4 billion over March 2020 and decreased 37.1% over April 2019. Compared to March 2020, overall sales decreased in 21 of 21 industries representing 100.0% of all manufacturing sectors. Durable goods decreased 38.3% to $15.7 billion over Mar 2020 and decreased 47.5% over April 2019. Non-durable goods decreased 18.7% to $20.7 billion over Mar 2020 and decreased 25.8% over April 2019.
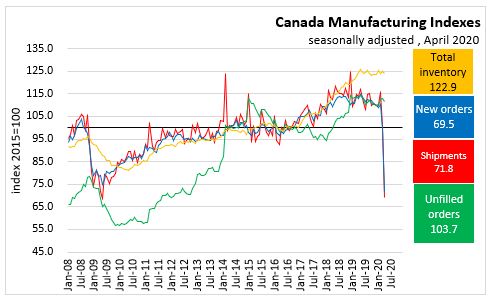
Inventory to sales ratio increased to 2.41 in April 2020. Unfilled orders decreased -1.2% to $98.4 billion. Unfilled orders were up in 9 of 21 industries with the largest in Miscellaneous manufacturing, and Plastic and rubber industries. largely offset by declines in Transportation equipment; Primary metal; Machinery. New orders decreased -31.3% to $35.1 billion over March 2020, mostly reflecting lower new orders in the transportation equipment (-85.9%) and the petroleum and coal product (-46.3%) industries.
PROVINCES
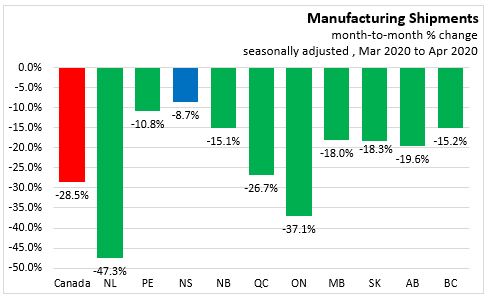
On a seasonally adjusted, month-over-month basis, Manufacturing sales all negative in all provinces in April 2020 over March 2020. Nova Scotia had the smallest decline at -8.7% . Newfoundland and Labrador shipment had the largest decline at -47.3% . In Canada shipments decreased 28.5%.
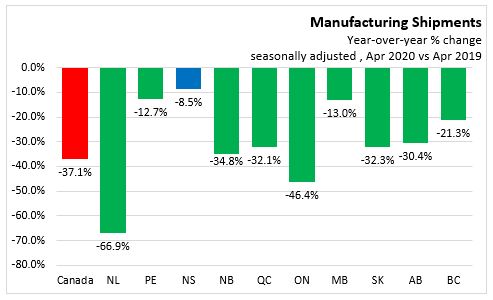
On a seasonally adjusted year-over-year basis, Manufacturing sales were negative in all provinces in April 2020 over April 2019. Nova Scotia had the smallest decline at -8.5%. Newfoundland and Labrador shipments had the largest decline at -66.9%. In Canada shipments decreased 37.1%.
NOVA SCOTIA SECTORS
In Nova Scotia April 2020, seasonally adjusted Manufacturing Shipments decreased 8.7% to $682.1 million over March 2020 and decreased 8.5% over April 2019. Nova Scotia manufacturing shipments have been on an upward trend since the beginning of 2014 with rising durable (i.e. wood products, metal products, machinery, transportation equipment) and rising non-durable (i.e. food, paper/pulp, chemical, plastic and rubber) shipments.
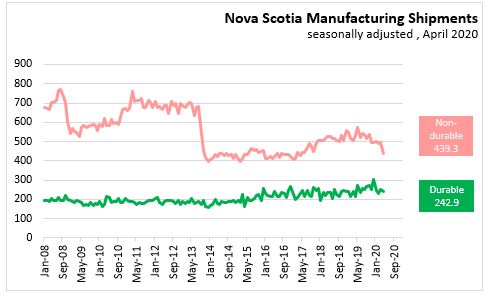
Seasonally adjusted non-durable shipments have risen from $405.2 million in January 2015 to $439.3 million in April 2020. Durable shipments have increased from $191.9 million in January 2015 to $242.9 million in April 2020.
Unadjusted Year-over-year
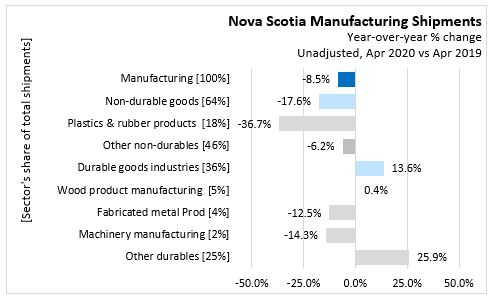
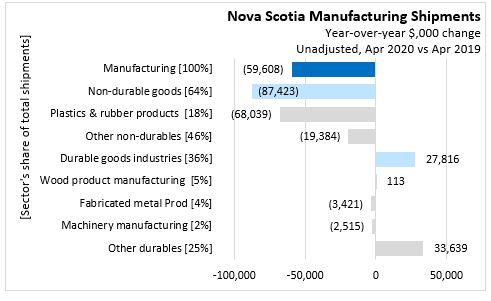
Unadjusted year-over-year (Apr 2020 vs Apr 2019), Manufacturing Shipments decreased 8.5% ($59.6 million).
- Non-durable goods shipments, accounting for 64% of Manufacturing Shipments , decreased 17.6% ($87.4 million).
- Plastics & rubber products with a 18% of Manufacturing Shipments , decreased 36.7% ($68.0 million).
- Other non-durables with a 46% of Manufacturing Shipments , decreased 6.2% ($19.4 million).
- Durable goods industries with a 36% of Manufacturing Shipments , increased 13.6% ($27.8 million).
- Wood product manufacturing with a 5% of Manufacturing Shipments , increased 0.4% ($0.1 million).
- Fabricated metal Prod with a 4% of Manufacturing Shipments , decreased 12.5% ($3.4 million).
- Machinery manufacturing with a 2% of Manufacturing Shipments , decreased 14.3% ($2.5 million).
- Other durables with a 25% of Manufacturing Shipments , increased 25.9% ($33.6 million).
CENSUS METROPOLITAN AREAS (CMA) SECTORS
HALIFAX CMA
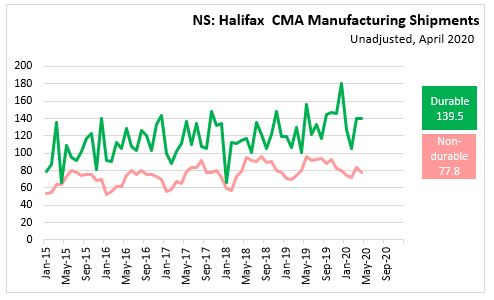
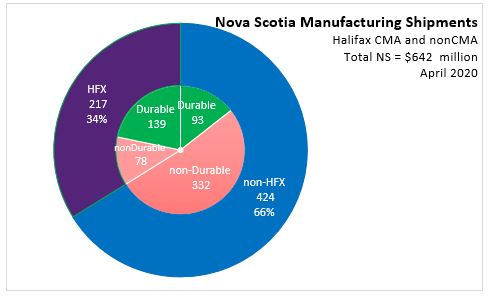
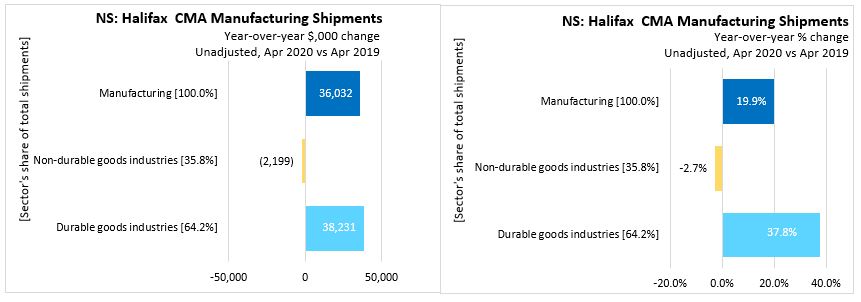
In Halifax, month-to-month/year-over-year, unadjusted manufacturing shipments have declined 2.9% to $217.3 million over March 2020 and increased 19.9% over April 2019.
- Non-durable shipments have declined 6.5% to $77.8 million over March 2020 and declined 2.7% over April 2019.
- Durable shipments have declined 0.8% to $139.5 million over March 2020 and increased 37.8% over April 2006.
THE REST OF NOVA SCOTIA
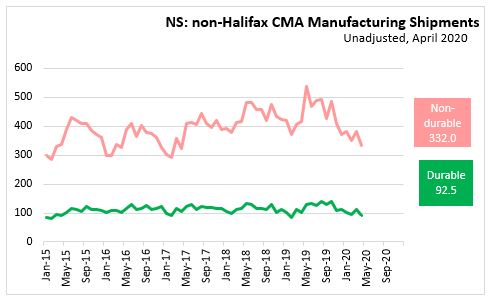
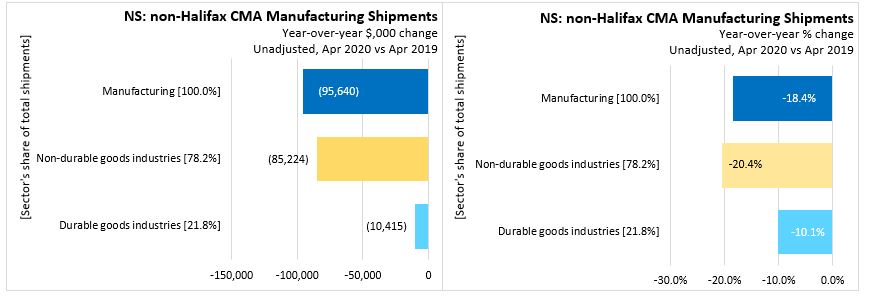
In the rest of Nova Scotia, month-to-month/year-over-year, unadjusted manufacturing shipments have declined 13.8% to $424.5 million over March 2020 and declined 18.4% over April 2019.
- Non-durable shipments have declined 12.9% to $332.0 million over March 2020 and declined 20.4% over April 2019.
- Durable shipments have declined 16.8% to $92.5 million over March 2020 and declined 10.1% over April 2019.
SOURCES
Statistics Canada Monthly survey of Manufacturing
Statistics Canada. Table 16-10-0047-01 Manufacturers' sales, inventories, orders and inventory to sales ratios, by industry (dollars unless otherwise noted)
Statistics Canada. Table 16-10-0048-01 Manufacturing sales by industry and province, monthly (dollars unless otherwise noted) (x 1,000)
Statistics Canada. Table 16-10-0011-01 Manufacturing sales, by industry for 12 Selected Census Metropolitan Areas (x 1,000)
<--- Return to Archive