The Economics and Statistics Division maintains archives of previous publications for accountability purposes, but makes no updates to keep these documents current with the latest data revisions from Statistics Canada. As a result, information in older documents may not be accurate. Please exercise caution when referring to older documents. For the latest information and historical data, please contact the individual listed to the right.
<--- Return to Archive
For additional information relating to this article, please contact:
June 16, 2020US RETAIL SALES, MAY 2020 The U.S. Census Bureau announced today the advance estimates of US retail and food service sales for May 2020. Due to COVID-19, many businesses are operating on a limited capacity or have ceased operations completely.
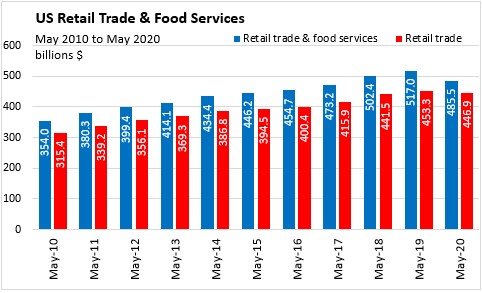
U.S retail and food service sales for May 2020, was a seasonally adjusted, month-over-month 17.7 per cent increase ($73.0 billion) over April 2020 to $485.5 billion, and a year-over-year 6.1 per cent decrease over May 2019.
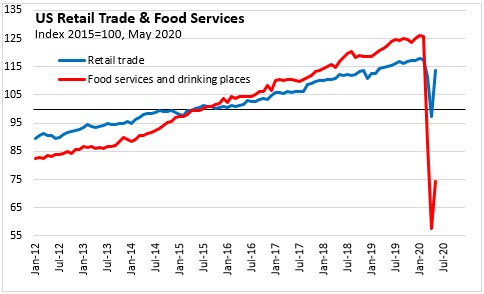
Excluding food services and drinking places, retail trade sales increased 16.8 per cent over April 2020, and decreased 1.4 per cent over May 2019. Food service and drinking place month-over-month receipts increased 29.1 per cent to $38.6 billion.
Year-over-Year
In May 2020, United States seasonally adjusted Retail Trade & Food Services decreased 6.1 per cent over May 2019. Retail trade decreased 1.4 per cent and food services and drinking places sales decreased 39.4 per cent.
SECTOR ANALYSIS
Compared to the previous month, sales were up in all 13 retail categories in May 2020. The fastest gains (in percentage terms) being reported in Clothing Stores (+188.0%), Furniture (+89.7%) and Sporting & Recreation (+88.2%). Sales were up in Food Services and Drinking Places (+29.1%).
Year-over-Year
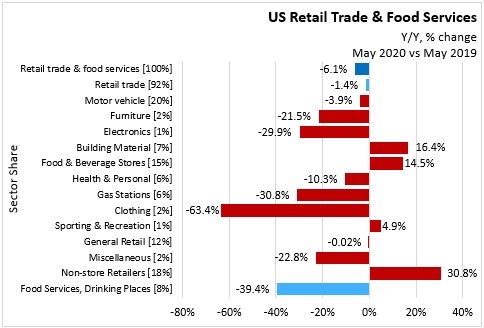
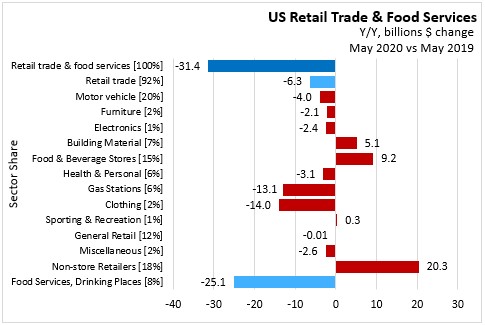
In May 2020 vs May 2019,
Retail Trade, 92.0% of total retail trade & food services, decreased 1.4% ($6.3 billion) to $447 billion.
- Motor vehicle sector, 20.3% of total retail trade & food services, decreased 3.9% ($4.0 billion).
- Furniture stores, 1.6% of total retail trade & food services, decreased 21.5% ($2.1 billion).
- Electronics stores, 1.2% of total retail trade & food services, decreased 29.9% ($2.4 billion).
- Building materials, 7.5% of total retail trade & food services, increased 16.4% ($5.1 billion).
- Food and beverage stores, 15.0% of total retail trade & food services, increased 14.5% ($9.2 billion).
- Heath, personal care stores, 5.6% of total retail trade & food services, decreased 10.3% ($3.1 billion).
- Gasoline Stations, 6.1% of total retail trade & food services, decreased 30.8% ($13.1 billion).
- Clothing stores, 1.7% of total retail trade & food services, decreased 63.4% ($14.0 billion).
- Sports and hobby stores, 1.4% of total retail trade & food services, increased 4.9% ($0.3 billion).
- General merchandise stores, 12.3% of total retail trade & food services, decreased 0.02% ($0.01 billion).
- Miscellaneous retail, 1.8% of total retail trade & food services, decreased 22.8% ($2.6 billion).
- Non-store retailers, 17.8% of total retail trade & food services, increased 30.8% ($20.3 billion).
Food services & drinking places, 8.0% of total retail trade & food services, decreased 39.4% ($25.1 billion).
Source: US Census Bureau, Data Tables
<--- Return to Archive