The Economics and Statistics Division maintains archives of previous publications for accountability purposes, but makes no updates to keep these documents current with the latest data revisions from Statistics Canada. As a result, information in older documents may not be accurate. Please exercise caution when referring to older documents. For the latest information and historical data, please contact the individual listed to the right.
<--- Return to Archive
For additional information relating to this article, please contact:
June 17, 2020ANALYSIS OF NOVA SCOTIA'S CONSUMER PRICE INDEX FOR MAY 2020 TRENDS - MAY 2020
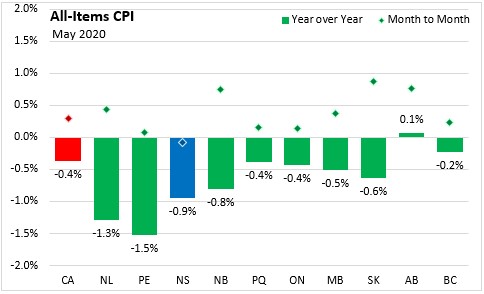
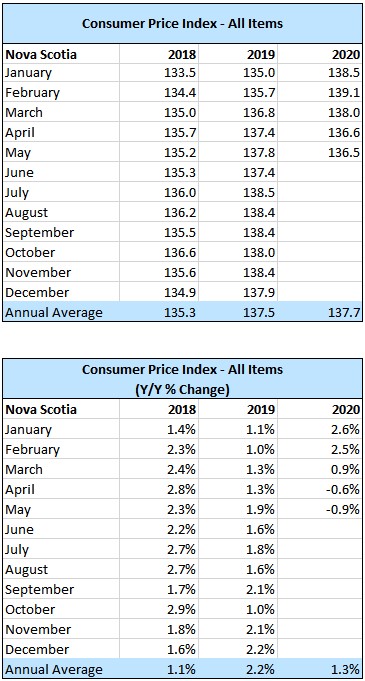
In Nova Scotia May 2020, the year over year the All-Items Consumer Price Index (CPI) was down 0.9 per cent, while the national CPI index declined 0.4 per cent. Monthly consumer prices were down 0.1 per cent in Nova Scotia and up 0.3 per cent nationally.
All provinces except Alberta (+0.1%) had negative year-over-year inflation for May 2020. Prince Edward Island (-1.5%) had the largest CPI decline compared to May 2019, followed by Newfoundland (-1.3%) and Nova Scotia (-0.9%). On a monthly basis, the CPI index was up in all provinces except Nova Scotia (-0.1%).
National year-over-year CPI growth further decreased from -0.2 per cent in April to -0.4 per cent in May, despite positive energy price growth for the month. Transportation prices contributed the most to the year-over-year decline in the CPI, which reflected the decrease in gasoline prices relative to May 2019. Food prices (+3.1%) had the largest year-over-year increase among the major categories.
Nationally, rent and mortgage interest costs decreased in May. Physical distancing measures and employment losses contributed to lower demand for rentals, and major commercial banks lowered mortgage rates in response to falling bond yields and policy interest rate cuts. Telephone services prices fell 2.4 per cent in the month, on promotions offered by major wireless carriers. Reduced demand for traveller accommodations contributed to a 21.3 per cent decline in prices compared to May 2019, the largest year-over-year decline on record. Gasoline prices rose 16.9 per cent on a month-over-month basis in May, after falling for two consecutive months. Rising global demand for oil and gas, as well as production cuts from major oil producers contributed to the monthly increase in gasoline prices. A weaker Canadian dollar and supply disruptions from COVID-19 contributed to rising prices for meat and non-perishable foods, with fresh or frozen beef prices up 13.7 per cent, year-over-year.
Impact of COVID-19 on the Consumer Price Index
Statistics Canada continued special CPI program measures for May 2020. In-person field collection was conducted via telephone or internet and supplemented with web scraping, transaction data, and administrative data. Due to COVID-19 impact on product availability, select sub-components of the CPI received temporary special imputations. The sub-indexes for housekeeping services; personal care services; travel tours; spectator entertainment and use of recreational facilities were imputed from the monthly change in the all-items index - effectively removing the impact of these goods and services on the CPI. Air transportation that was purchased but cancelled is excluded from calculations. Indexes for alcohol consumption in licensed establishments was imputed based on prices from stores.
The main contributors to the monthly (May 2020 vs. April 2020) NS CPI movement were:
- Gasoline (+15.1%)
- Fresh or frozen beef (+11.4%)
- Financial services (+4.3%)
- Fuel oil and other fuels (-14.2%)
- Rent (-1.6%)
- Women's clothing (-5.2%)
Contributors to the annual (May 2020 vs. May 2019) NS CPI movement were:
- Purchase and leasing of passenger vehicles (+2.0%)
- Passenger vehicle insurance premiums (+7.1%)
- Rent (+2.7%)
- Gasoline (-37.5%)
- Fuel oil and other fuels (-35.4%)
- Telephone service (-8.7%)
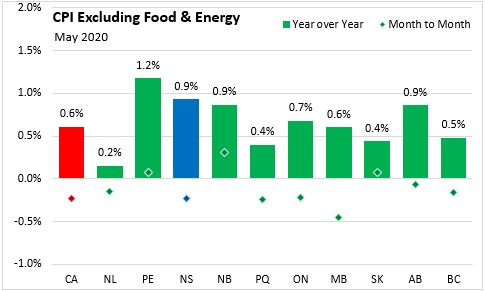
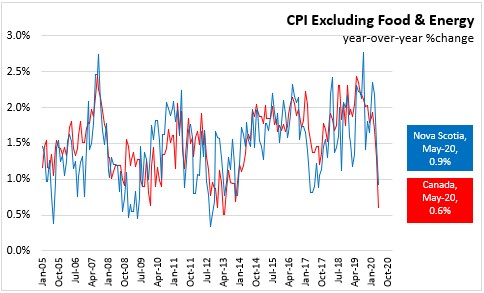
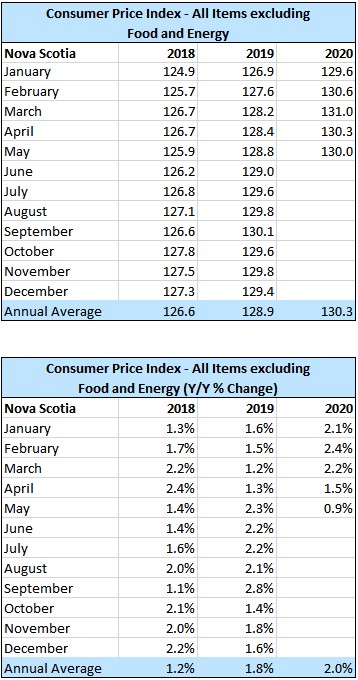
Nova Scotia's consumer price inflation (year-over-year growth in CPI) excluding food and energy was 0.9 per cent in May, compared to a national rate of 0.6 per cent. Prince Edward Island (1.2%), followed by Nova Scotia, New Brunswick and Alberta at 0.9 per cent, reported the largest price level increases.
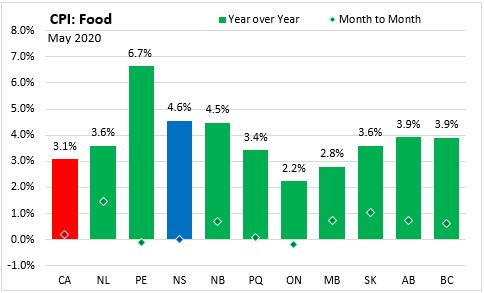
In May, the CPI for food in Nova Scotia increased 4.6 per cent year-over-year with no change month-to-month. CPI growth in food (year-over-year) was up in all provinces compared to May 2019. Prince Edward Island posted the highest year-over-year food price growth (+6.7 per cent). Nationally, annual food prices increased 3.1 per cent.
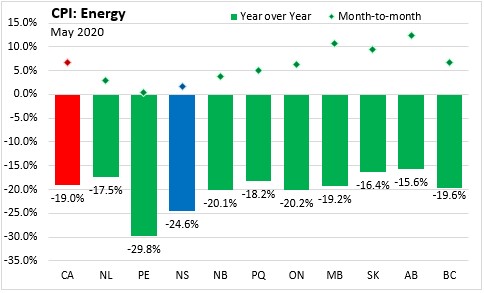
The Nova Scotia energy price index decreased by 24.6 per cent compared to a year ago. Year-over-year energy price indexes decreased in every province with the largest decline in Prince Edward Island (-29.8 per cent). Monthly energy prices (May 2020 vs. April 2020) were up 1.7 per cent in Nova Scotia and 6.8 per cent nationally. All provinces experienced positive monthly energy price growth in May, with the largest increase in Alberta (12.5%)
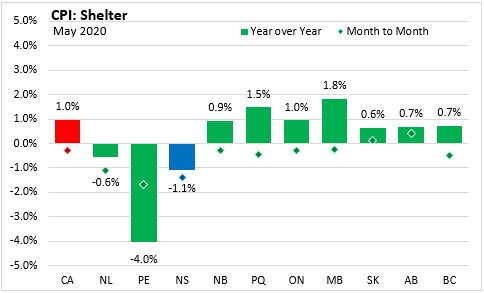
Year-over-year, the consumer price index for shelter decreased 1.1 per cent in Nova Scotia and increased 1.0 per cent in Canada. Prince Edward Island (-4.0%) reported the largest decline in the shelter price index for May.
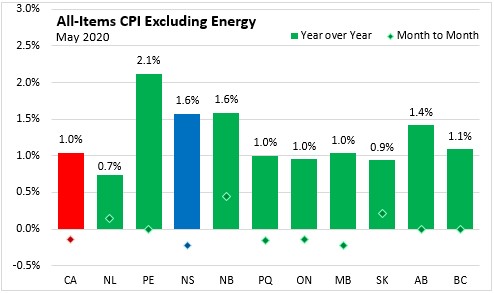
Nova Scotia's consumer price inflation (year-over-year growth in CPI) excluding energy was 1.6 per cent in May, compared to a national rate of 1.0 per cent. Prince Edward Island (2.1%), followed by Nova Scotia and New Brunswick at 1.6 per cent, reported the largest price level increases in CPI excluding energy.
Major Components for May 2020
The following table shows the price increases specific to Nova Scotia for the major components of the CPI this month:

Long Run Trends
In May 2020, the All-Items CPI year-over-year inflation rate for Nova Scotia was -0.9 per cent, below Canada's at -0.4 per cent. Nova Scotia's annual inflation has mostly been below the Canadian average since mid-2014, with the exception of only a few months. While month to month movements in the indices can be different, over time they generally follow the same overall trend. Nova Scotia’s year-over-year CPI inflation is currently at levels not seen since July 2009.

Annual inflation for the CPI excluding food and energy in Nova Scotia (+0.9%) was higher than the national rate (+0.6%) in May 2020.
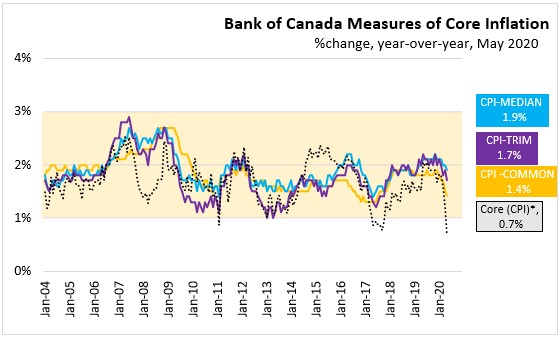
Bank of Canada's preferred measures of core inflation
Compared with May 2019, CPI-Common increased 1.4 per cent, CPI-Median rose 1.9 per cent and CPI-Trim was up 1.7 per cent in Canada. All-items CPI excluding eight of the most volatile components as defined by the Bank of Canada, and excluding the effect of changes in indirect taxes (formerly referred to as CPIX), rose 0.7 per cent, year-over-year.
Appendix Tables and Charts
Source: Statistics Canada data portal: Tables 18-10-0004-01 and 18-10-0256-01
<--- Return to Archive