The Economics and Statistics Division maintains archives of previous publications for accountability purposes, but makes no updates to keep these documents current with the latest data revisions from Statistics Canada. As a result, information in older documents may not be accurate. Please exercise caution when referring to older documents. For the latest information and historical data, please contact the individual listed to the right.
<--- Return to Archive
For additional information relating to this article, please contact:
June 24, 2020FOOD SERVICES AND DRINKING PLACES, APRIL 2020 During the COVID-19 pandemic, comparisons of year-to-date averages and sums do not show Nova Scotia’s rapidly changing economic situation. The DailyStats will focus on year-over-year comparisons, comparing one month with the same month in the prior year. Where possible the DailyStats will make comparisons of seasonally adjusted data from the pre-COVID-19 period (January and February 2020) with the period during which COVID-19 measures were in place from March 2020 onwards.
"In March, a sequence of unprecedented government interventions were put in place related to COVID-19, including the closure of non-essential businesses, travel restrictions, and public health measures directing Canadians to limit public interactions. During this time, all provinces restricted access and implemented closures to businesses in the restaurant industry, which continued for the entire month of April and into subsequent months.
Based on respondent feedback, more than half (56%) of food service and drinking places operators reported being closed at some point in April, while 41% reported being closed for the entire month." Statistics Canada
Month over month
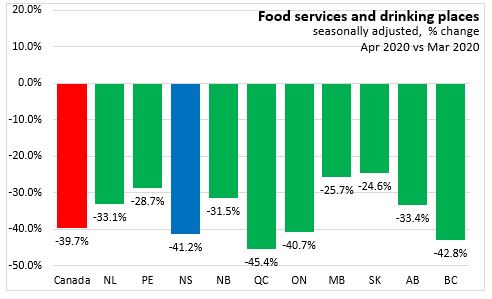
In April 2020, Statistics Canada on a month-over-month basis, reported that food services and drinking places receipts (seasonally adjusted) in Nova Scotia decreased 41.2 per cent to $58.4 million over March 2020. Food services and drinking places receipts (seasonally adjusted) in Canada decreased 39.7 per cent to $2.4 billion over March 2020.
All provinces reported monthly declines in food services and drinking places, with Saskatchewan (-24.6%) reporting the smallest decline, and Quebec (-45.4%) reporting the largest decline in percentage terms.
Year-over-Year
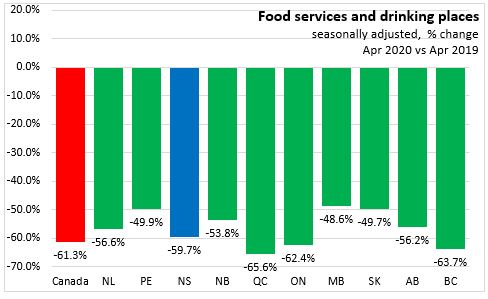
In April 2020, on a year-over-year basis, food services and drinking places receipts (seasonally adjusted) in Nova Scotia decreased 59.7 per cent over April 2019. Food services and drinking places receipts (seasonally adjusted) in Canada decreased 61.3 per cent over April 2019.
All provinces reported year-over-year declines in food services and drinking place receipts, with Manitoba (-48.6%) reporting the smallest decline and Quebec (-65.6%) reporting the largest decline in percentage terms.
Long-run Trend
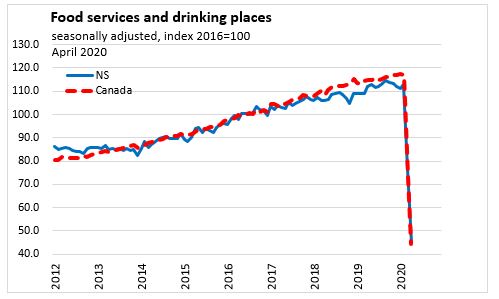
Although Nova Scotia’s food service and drinking place receipts exhibit somewhat more volatile growth from one month to the next, the provincial trend was in line with national growth up to 2017. Throughout 2018 and early 2019 Canada's growth in food services and drinking place receipts has been faster than growth in Nova Scotia. In the spring and summer of 2019, Nova Scotia’s food service and drinking place receipts started to catch up with national growth, peaking in September. Through the fall and winter, Nova Scotia's food services and drinking place receipts have slowed. With COVID-19, the bottom dropped out from both Canada and Nova Scotia markets.
Nova Scotia Year-over-year Sales by Establishment Type
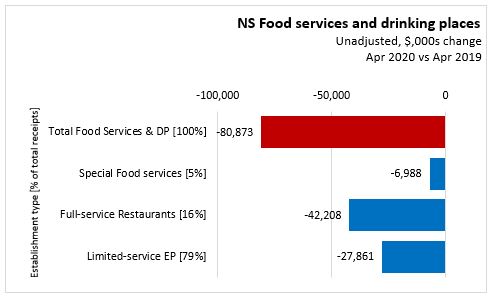

In Nova Scotia (April 2020 vs April 2019), Food service and drinking place establishments include:
- Limited service eating places, accounting for 78.8% of total food services and drinking places receipts , decreased 39.5 per cent ($27.9 million) over Apr 2020 vs Apr 2019 to $43 million.
- Full-service restaurants (16.0% of total Food services and drinking places receipts) decreased 83.0 per cent ($42.2 million) to $9 million.
- Special food services (5.0% of total Food services and drinking places receipts) decreased 71.9 per cent ($7.0 million) to $3 million.
- Data for drinking places was reported by Statistics Canada as too unreliable to publish
In Canada (April 2020 vs April 2019), Sales at drinking places saw the largest decline in percentage terms (-90.9%), as nightclubs and bars were closed and many do not have take-away food options. "Most (89%) drinking places were closed at some point in April, while 79% were closed for the entire month." Statistics Canada
Source: Statistics Canada. Table 21-10-0019-01 Monthly survey of food services and drinking places (x 1,000)
<--- Return to Archive